[TIL] Building a Spring Boot monitoring environment
한국어 원문은 여기에서 볼 수 있습니다.
Learning background
As important as developing an application is operating it stably after deployment.
A monitoring environment is needed to check whether the service operates normally, whether memory or CPU usage is excessive, and whether a failure can be quickly recognized.
In this lesson, we practiced the process of using Actuator to check the status of a Spring Boot application, collecting metrics with Prometheus, and visualizing them with Grafana.
In addition, we learned the flow of receiving application failure status through Slack notifications and checking application logs in Grafana using Loki.
What is monitoring?
Monitoring is the process of continuously observing and measuring the performance, stability, and availability of a system.
Rather than simply checking whether the server is turned on, it also checks application status, memory usage, number of requests, error logs, network status, etc.
Why monitoring is necessary
The biggest reason why monitoring is necessary is to quickly detect and respond to failures.
For example, if the server goes down while a user is using the service and the developer finds out about it late, the service will remain in a disabled state for that period of time.
However, if monitoring and notifications are set up, you can receive notifications through a channel such as Slack the moment the server status changes to abnormal and respond quickly.
Monitoring also helps find performance bottlenecks.
You can identify the cause of application problems more quickly by checking whether CPU usage is high, memory continues to increase, or request processing time is slow.
Spring Boot Actuator
What is an Actuator?
Spring Boot Actuator is a function that provides multiple endpoints to check the status and performance information of Spring Boot applications.
Typically, you can check the following information:
/actuator/health: Check application status/actuator/metrics: Check metric information/actuator/env: Check environment variables and setting information/actuator/loggers: Check logging settings-/actuator/prometheus: Provides metrics in a format that Prometheus can collect
In other words, the actuator plays the role of opening the internal state of the application so that it can be checked from the outside.
Why you need an Actuator
It is difficult to determine the status of a typical Spring Boot application simply by whether it is running or not.
Even if the server is turned on, the DB connection may be disconnected, memory usage may be abnormally high, or errors may continue to occur in certain requests.
Using Actuator, you can automate status checks in the operating environment because you can check the status information of the application through an endpoint.
How to use
Add Actuator dependency to build.gradle.
1
2
3
4
dependencies {
    implementation 'org.springframework.boot:spring-boot-starter-actuator'
    implementation 'org.springframework.boot:spring-boot-starter-web'
}
Add Actuator endpoint exposure settings to application.properties or application.yml.
1
2
3
4
5
spring.application.name=sample
server.port=8080

management.endpoints.web.exposure.include=*
management.endpoint.health.show-details=always
You can check the list of Actuator endpoints by accessing the following address in your browser.
1
http://localhost:8080/actuator
Health check can be done at the following address.
1
http://localhost:8080/actuator/health
/actuatorconnection result screen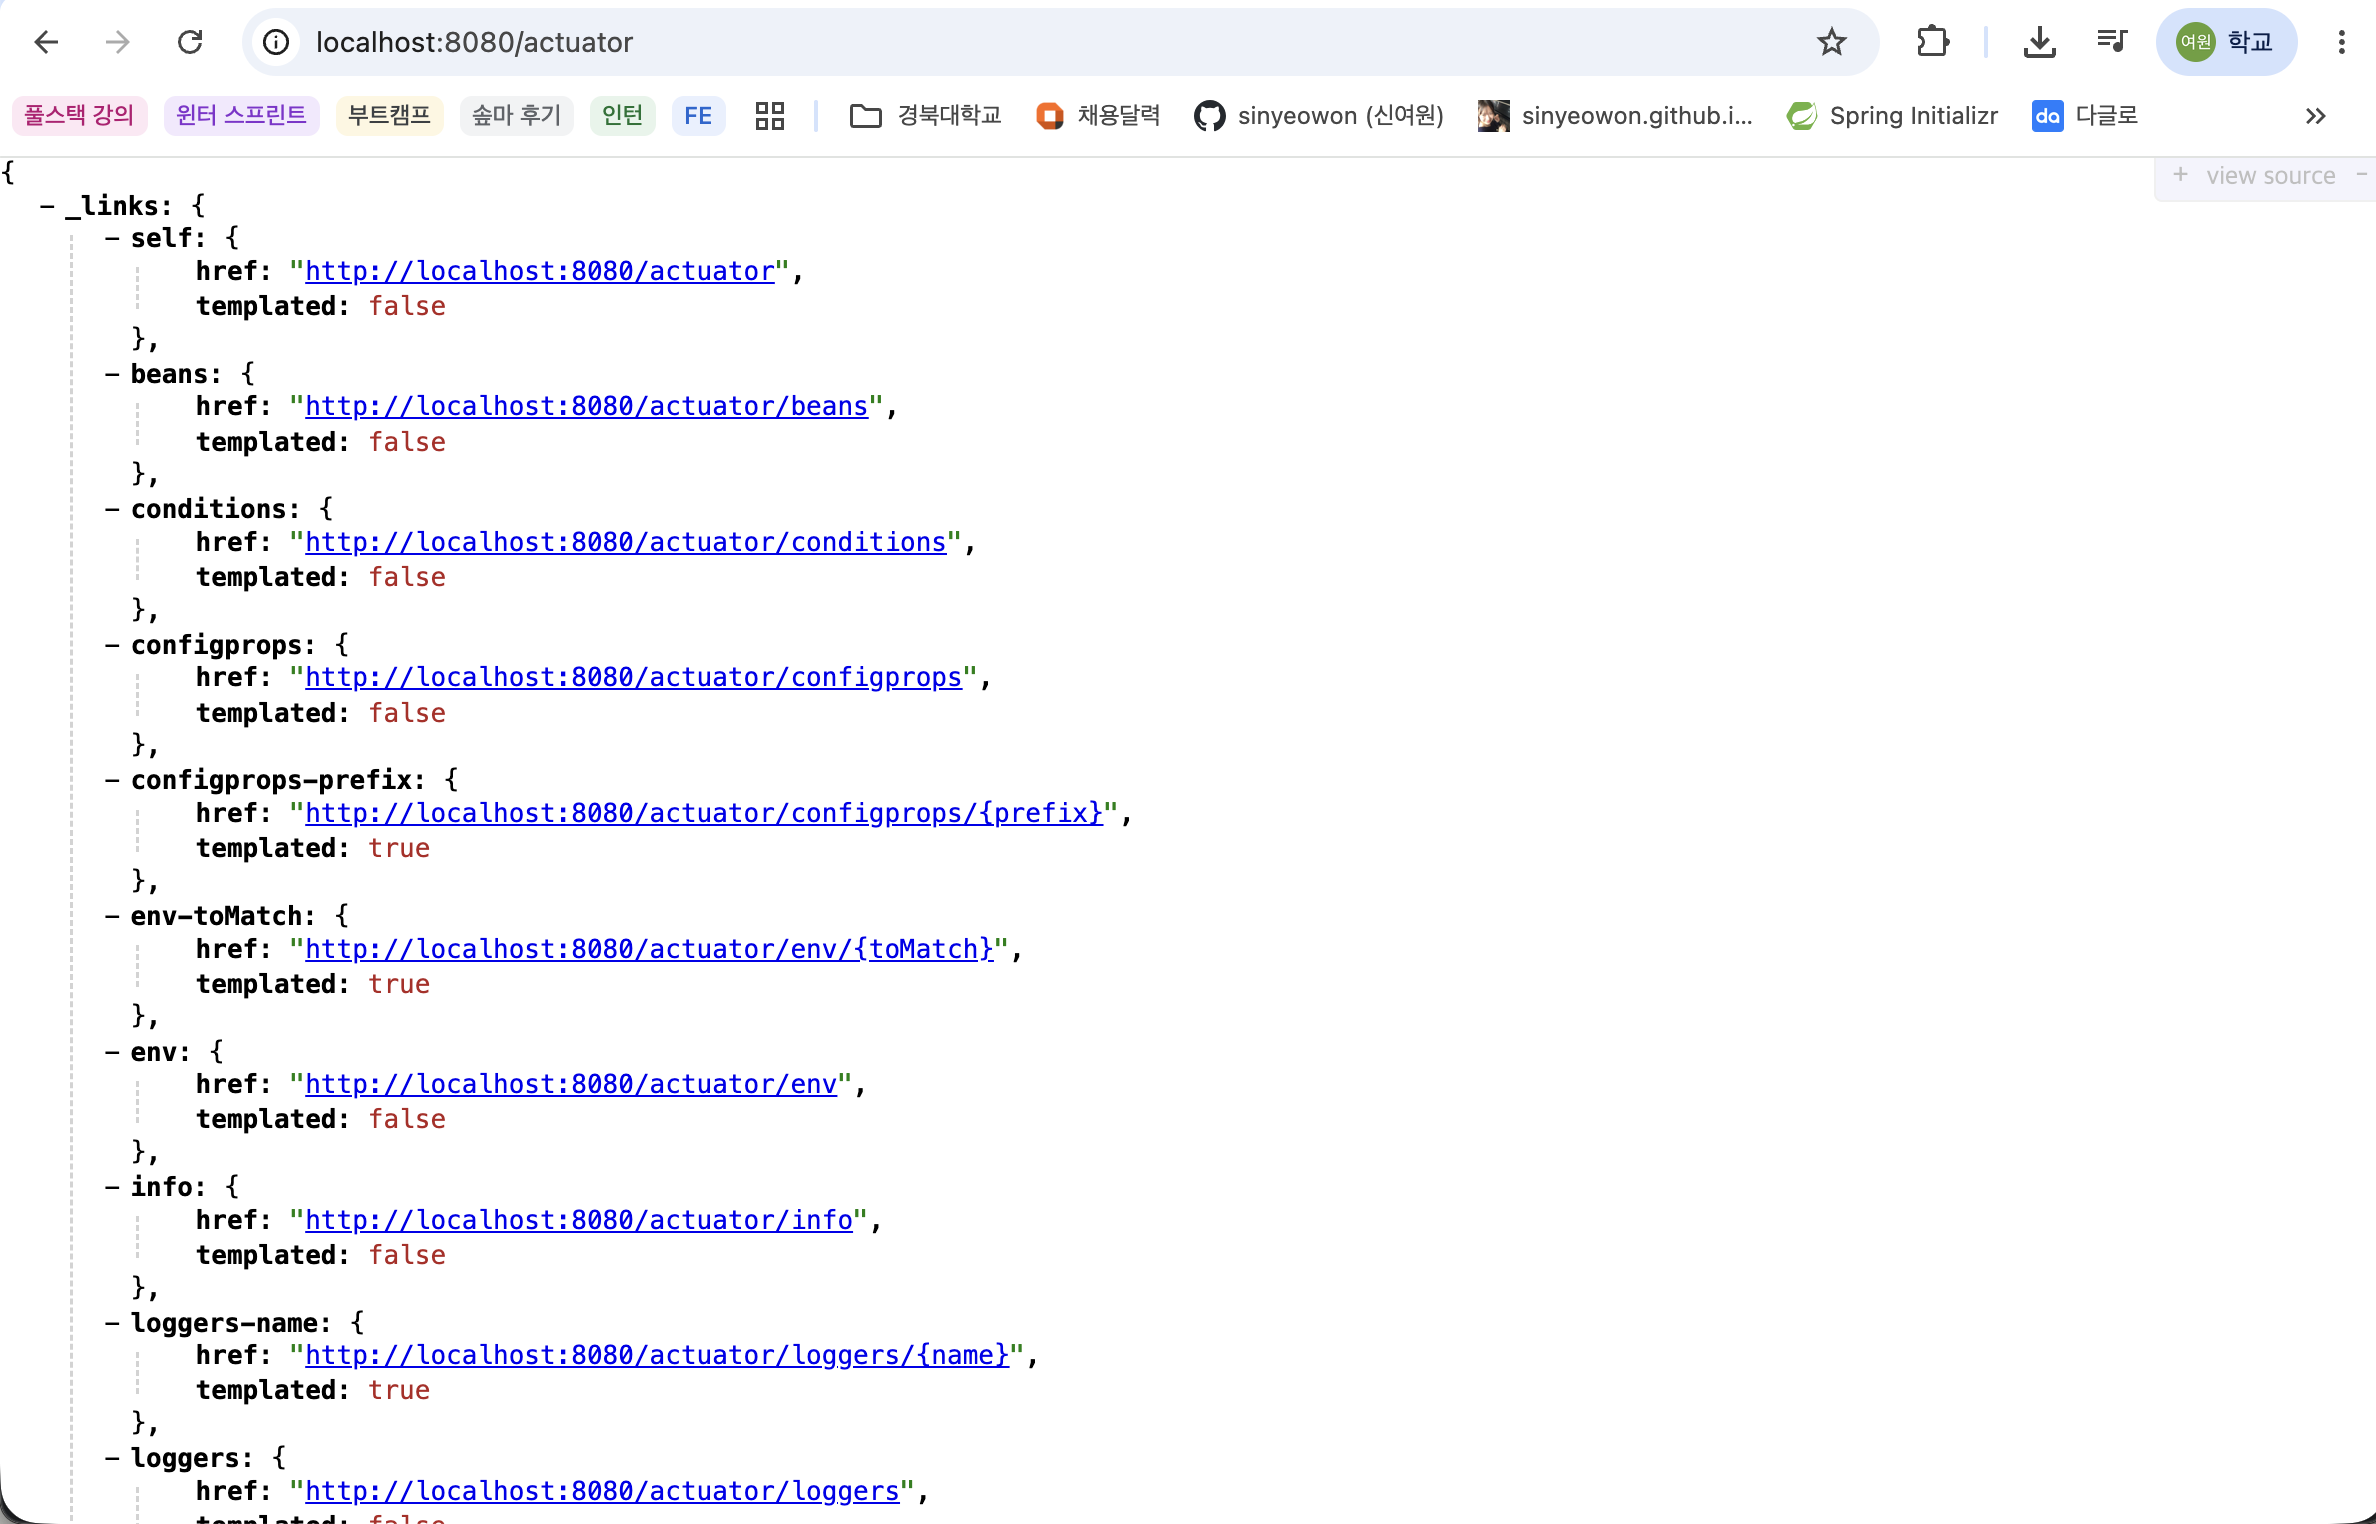
/actuator/healthconnection result screen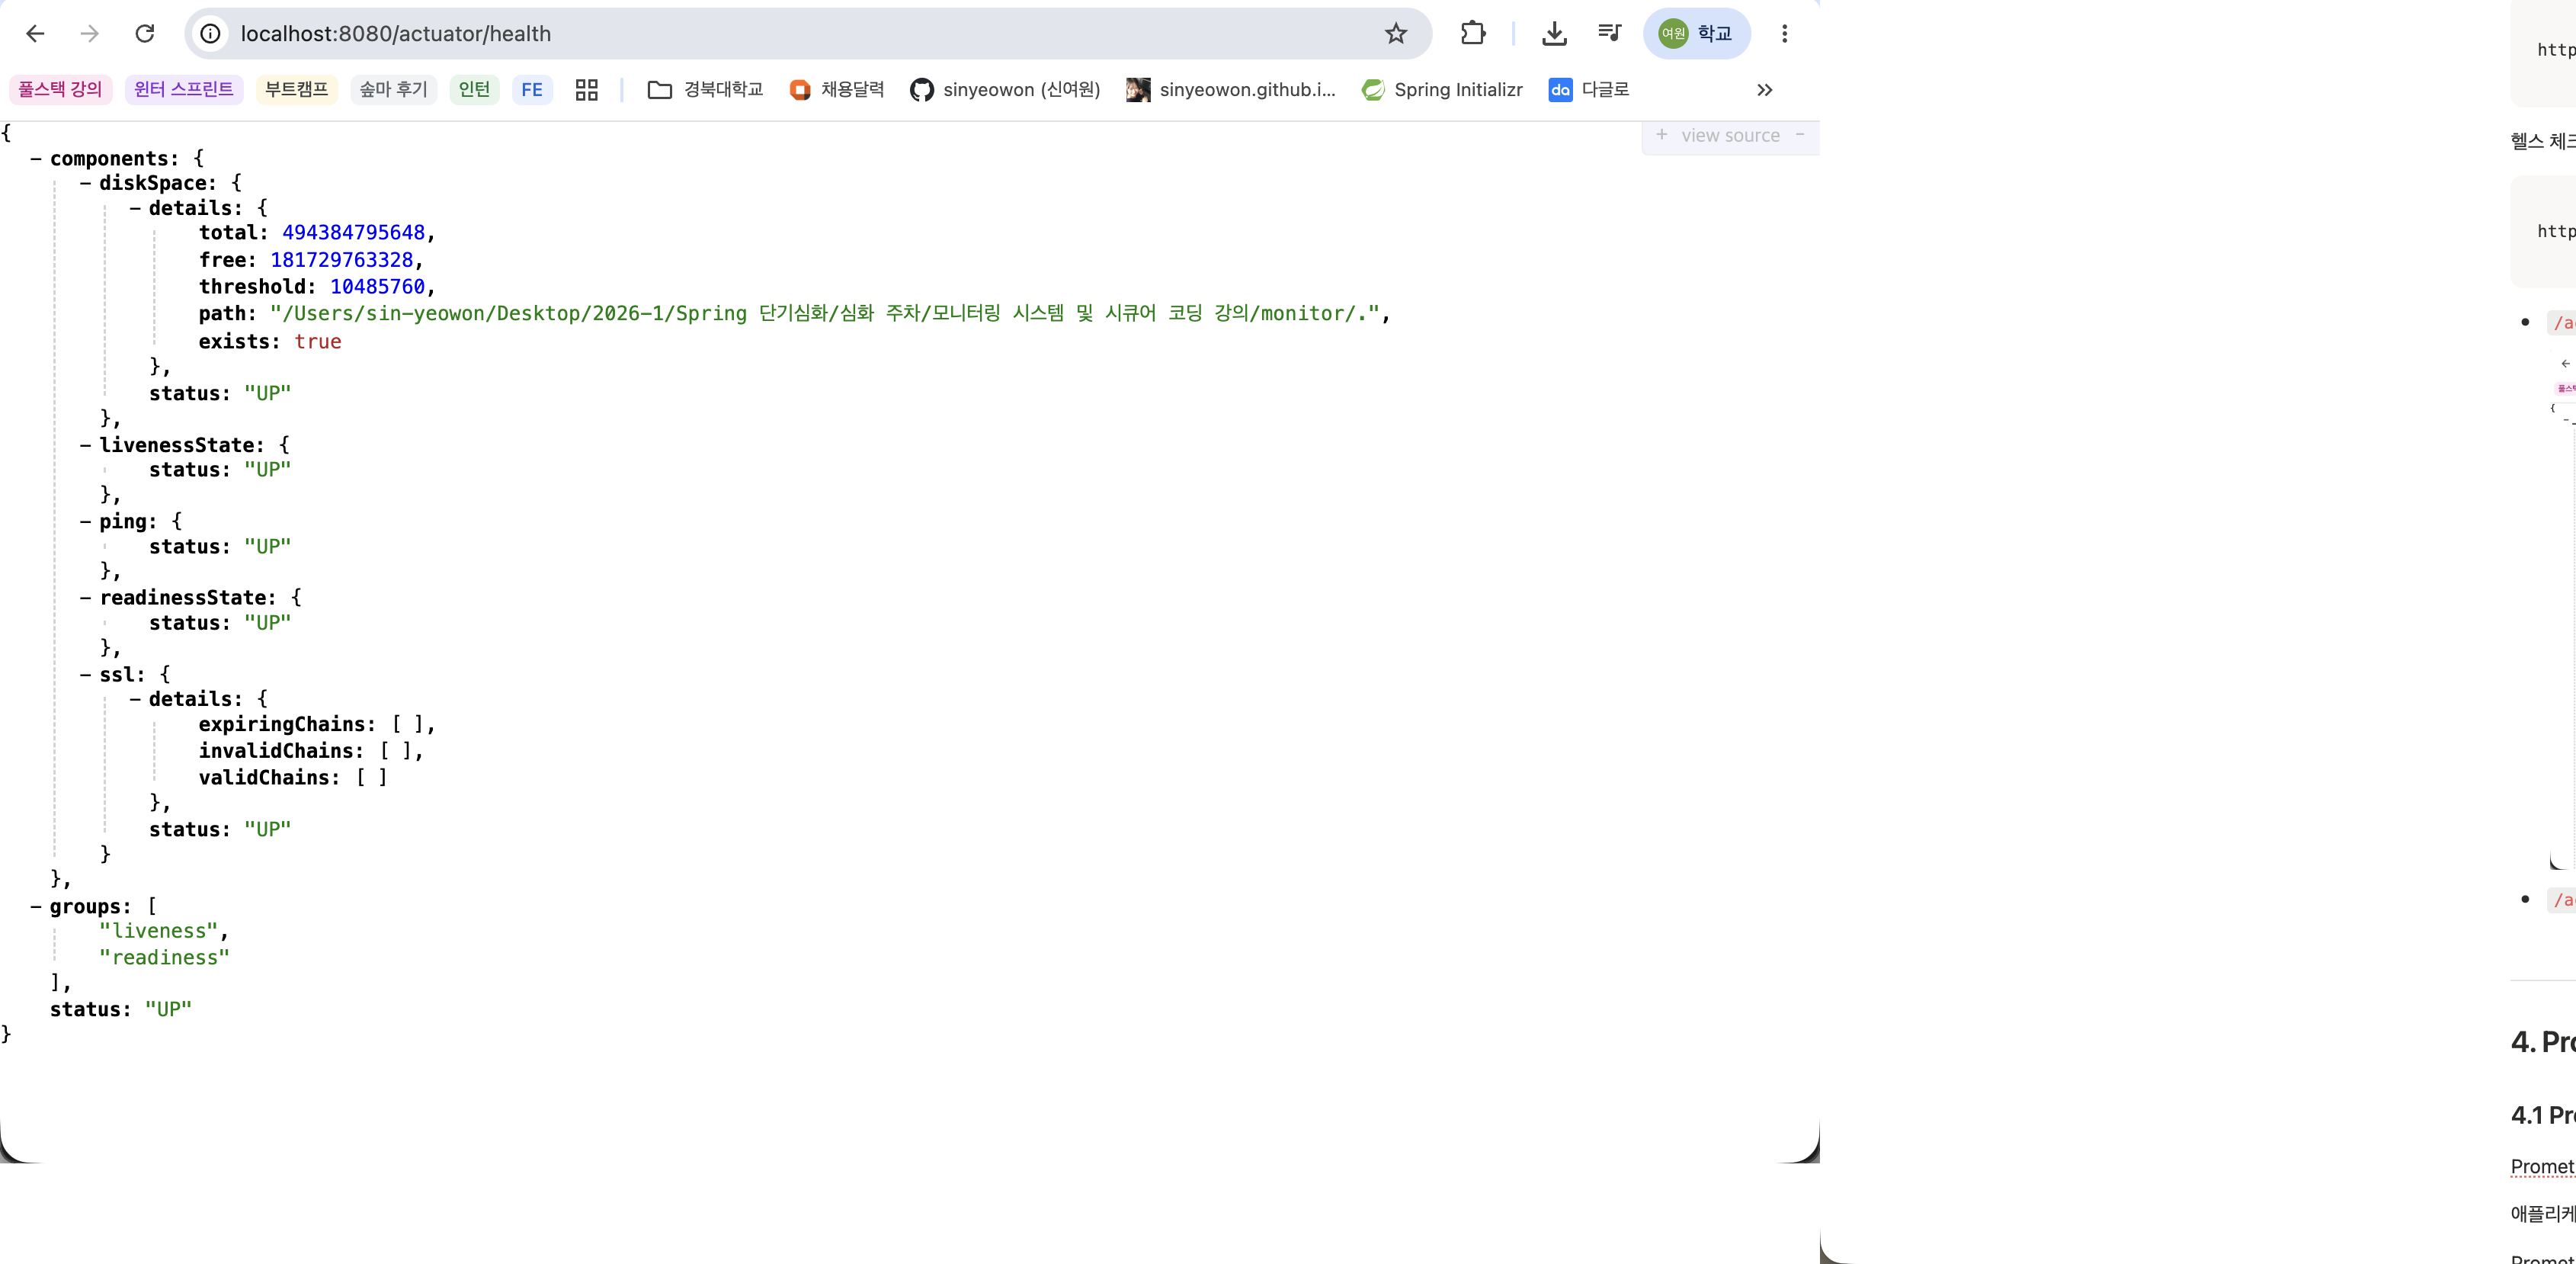
Prometheus
What is Prometheus?
Prometheus is an open source tool for system monitoring and alerting.
Metric data provided by applications or servers is periodically collected and stored.
- Metric data
- Data recording the system status in numbers
ex)
Metrics Meaning jvm_memory_used_bytesMemory in use by JVM http_server_requests_seconds_countHow many HTTP requests were made process_cpu_usageApplication CPU Utilization upIs Prometheus collecting apps normally?
Prometheus operates by pulling data directly.
In other words, when the Spring Boot application provides metrics, Prometheus accesses the address at regular intervals and collects data.
Why Prometheus?
Although it is possible to check the current state of the application using only the Actuator, it is difficult to store and analyze how the values have changed over time.
Because Prometheus periodically collects and stores metrics, the following analysis is possible.
Check when the application became slow
Track changes in CPU and memory usage
Check changes in the number of requests and errors
Alert occurs under certain conditions
In other words, while Actuator “plays the role of showing the state,” Prometheus “plays the role of continuously collecting and storing the state.”
Exposing Prometheus metrics in Spring Boot
Add the micrometer-registry-prometheus dependency so that Prometheus can collect Spring Boot metrics.
1
2
3
4
5
dependencies {
    implementation 'org.springframework.boot:spring-boot-starter-actuator'
    implementation 'org.springframework.boot:spring-boot-starter-web'
    runtimeOnly 'io.micrometer:micrometer-registry-prometheus'
}
Enable the Prometheus endpoint in the configuration file.
1
2
3
4
5
6
spring.application.name=sample
server.port=8080

management.endpoints.web.exposure.include=*
management.endpoint.health.show-details=always
management.endpoint.prometheus.enabled=true
Afterwards, you can check the metrics in Prometheus format at the following address.
1
http://localhost:8080/actuator/prometheus
/actuator/prometheusconnection result screen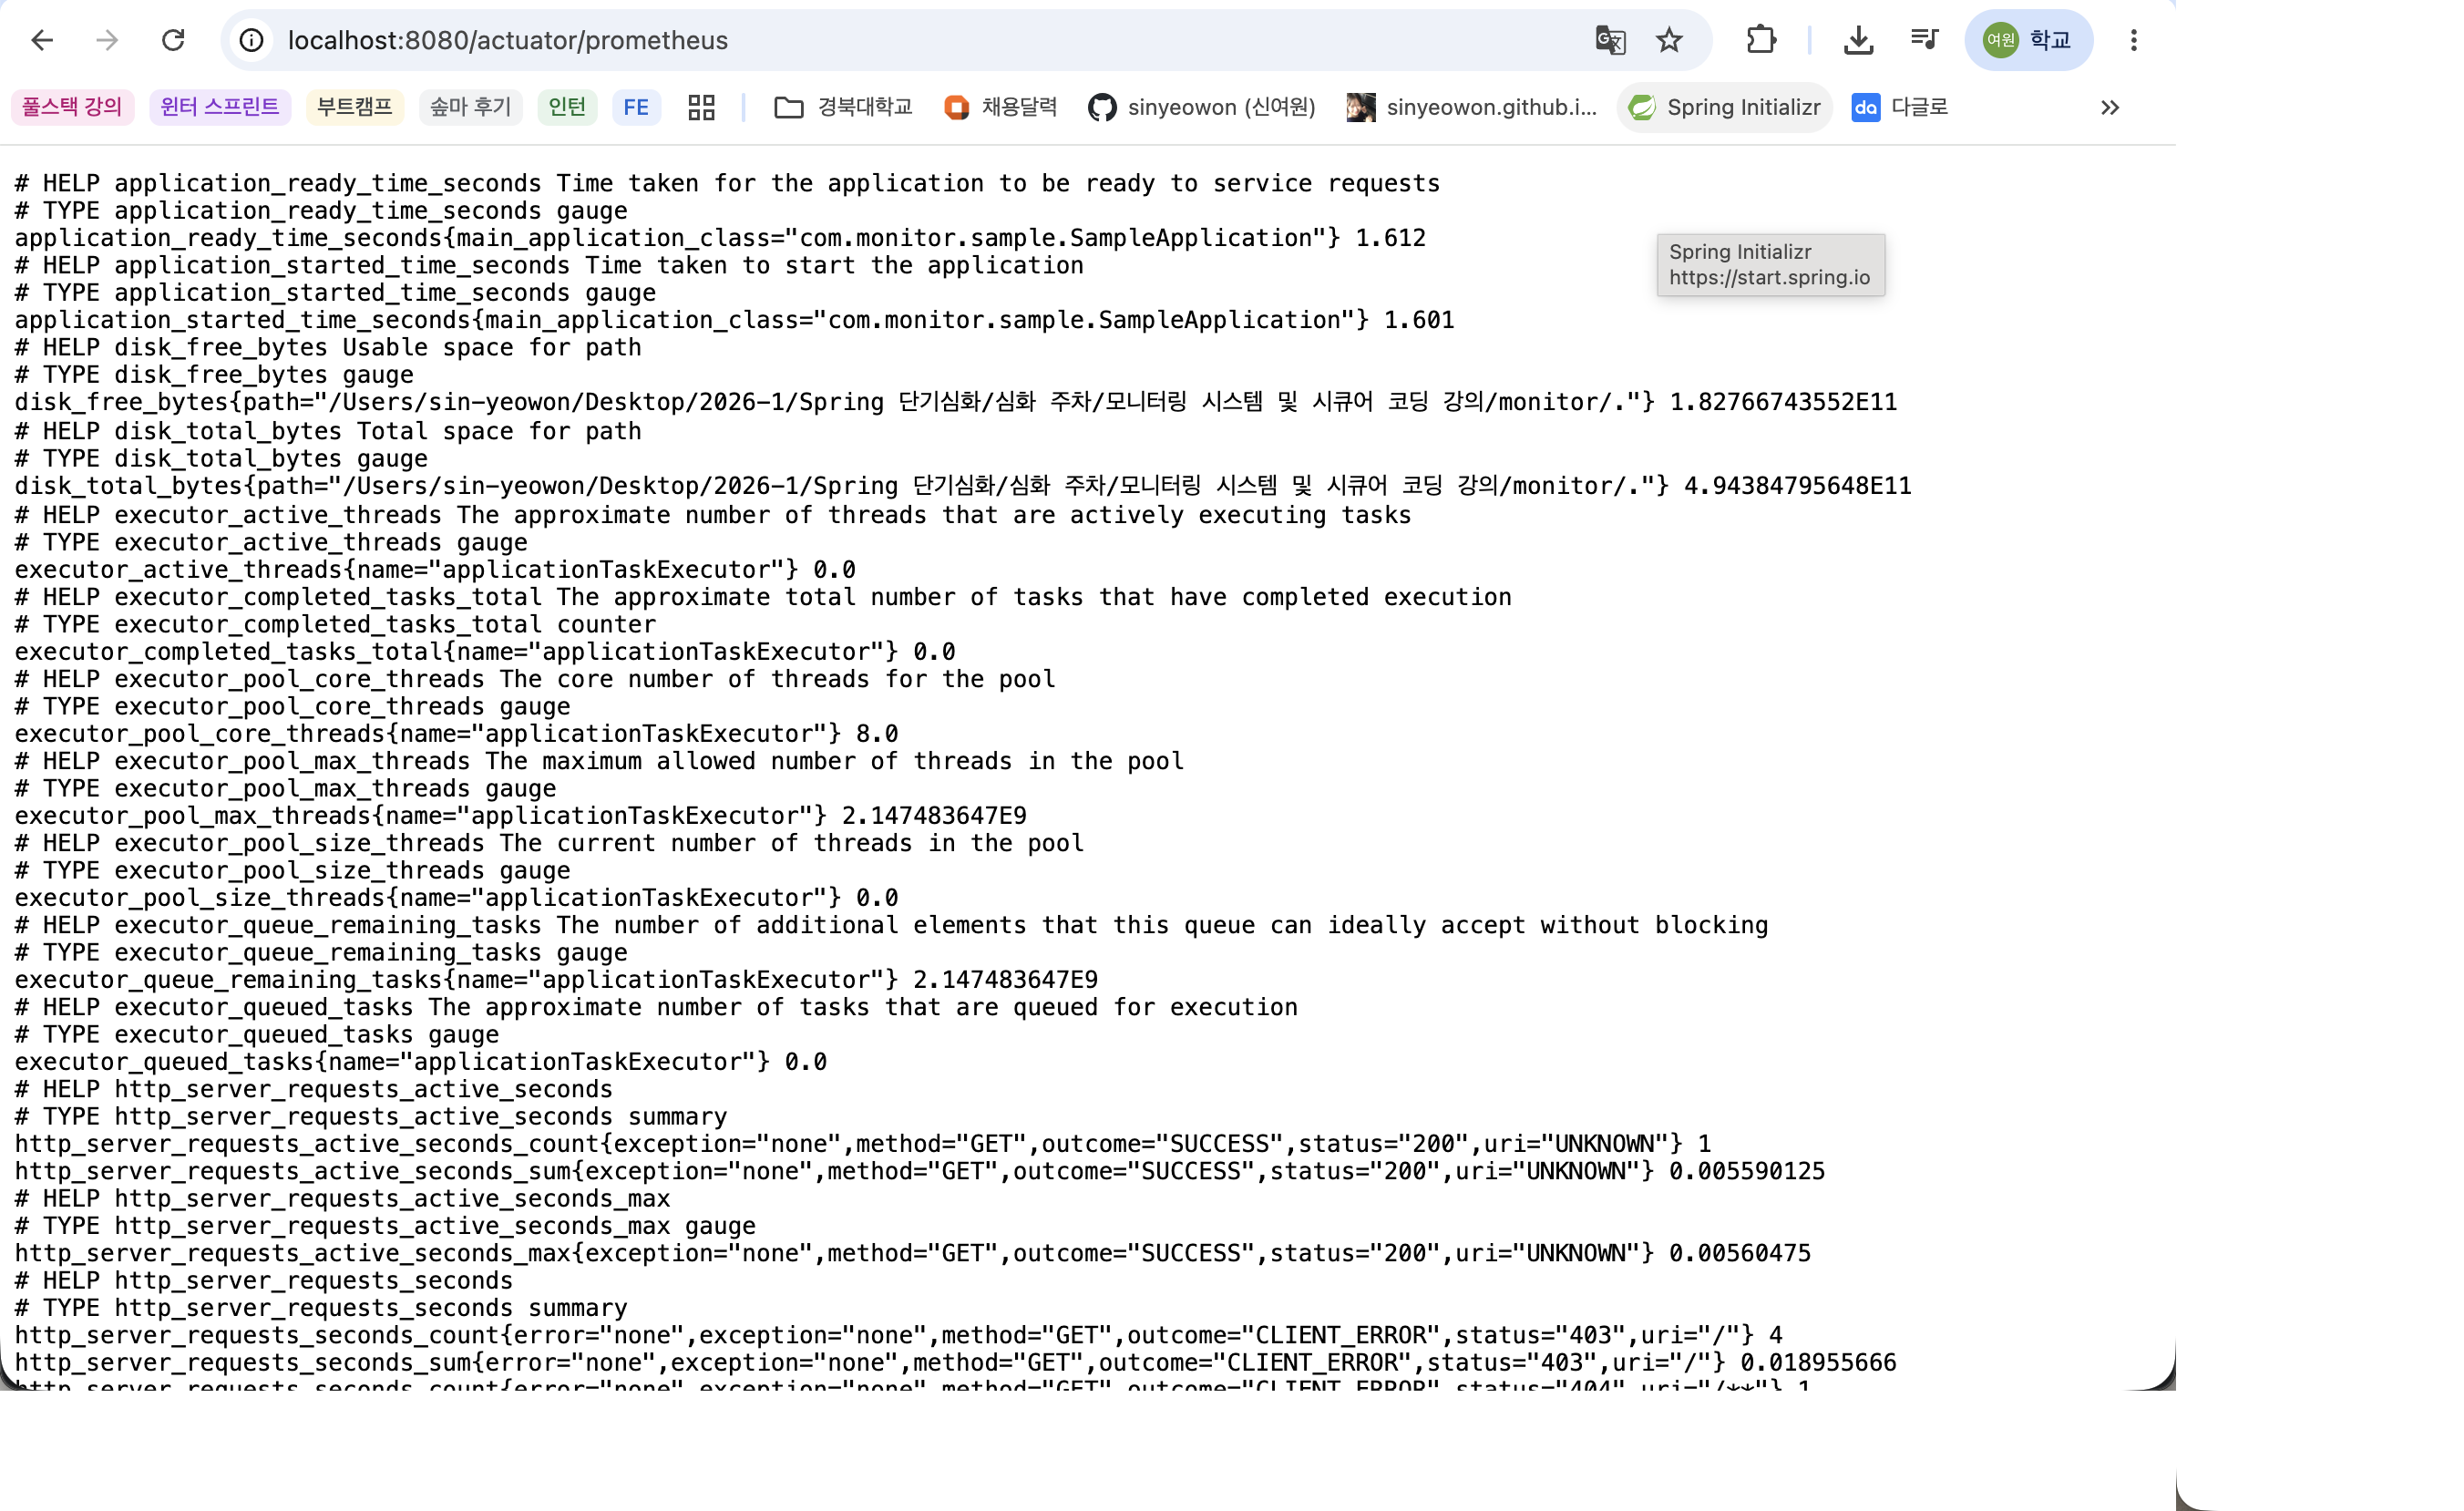
Prometheus configuration file
Create a prometheus.yml file to configure which applications Prometheus will monitor.
1
2
3
4
5
6
7
8
9
global:
  scrape_interval: 15s

scrape_configs:
  - job_name: 'spring-boot'
    metrics_path: '/actuator/prometheus'
    static_configs:
      - targets: ['host.docker.internal:8080']
Here, job_name is the name that identifies the collection object in Prometheus.
metrics_path is the path that provides Prometheus metrics in Spring Boot applications.
In targets, enter the application address to be collected.
Because I need to access the Spring Boot application on the host PC from the Docker container, I used host.docker.internal:8080.
Run Prometheus
Run Prometheus using Docker.
1
2
3
4
5
docker run -d \
  --name=prometheus \
  - p 9090:9090 \
  - v /path/to/prometheus.yml:/etc/prometheus/prometheus.yml \
  prom/prometheus
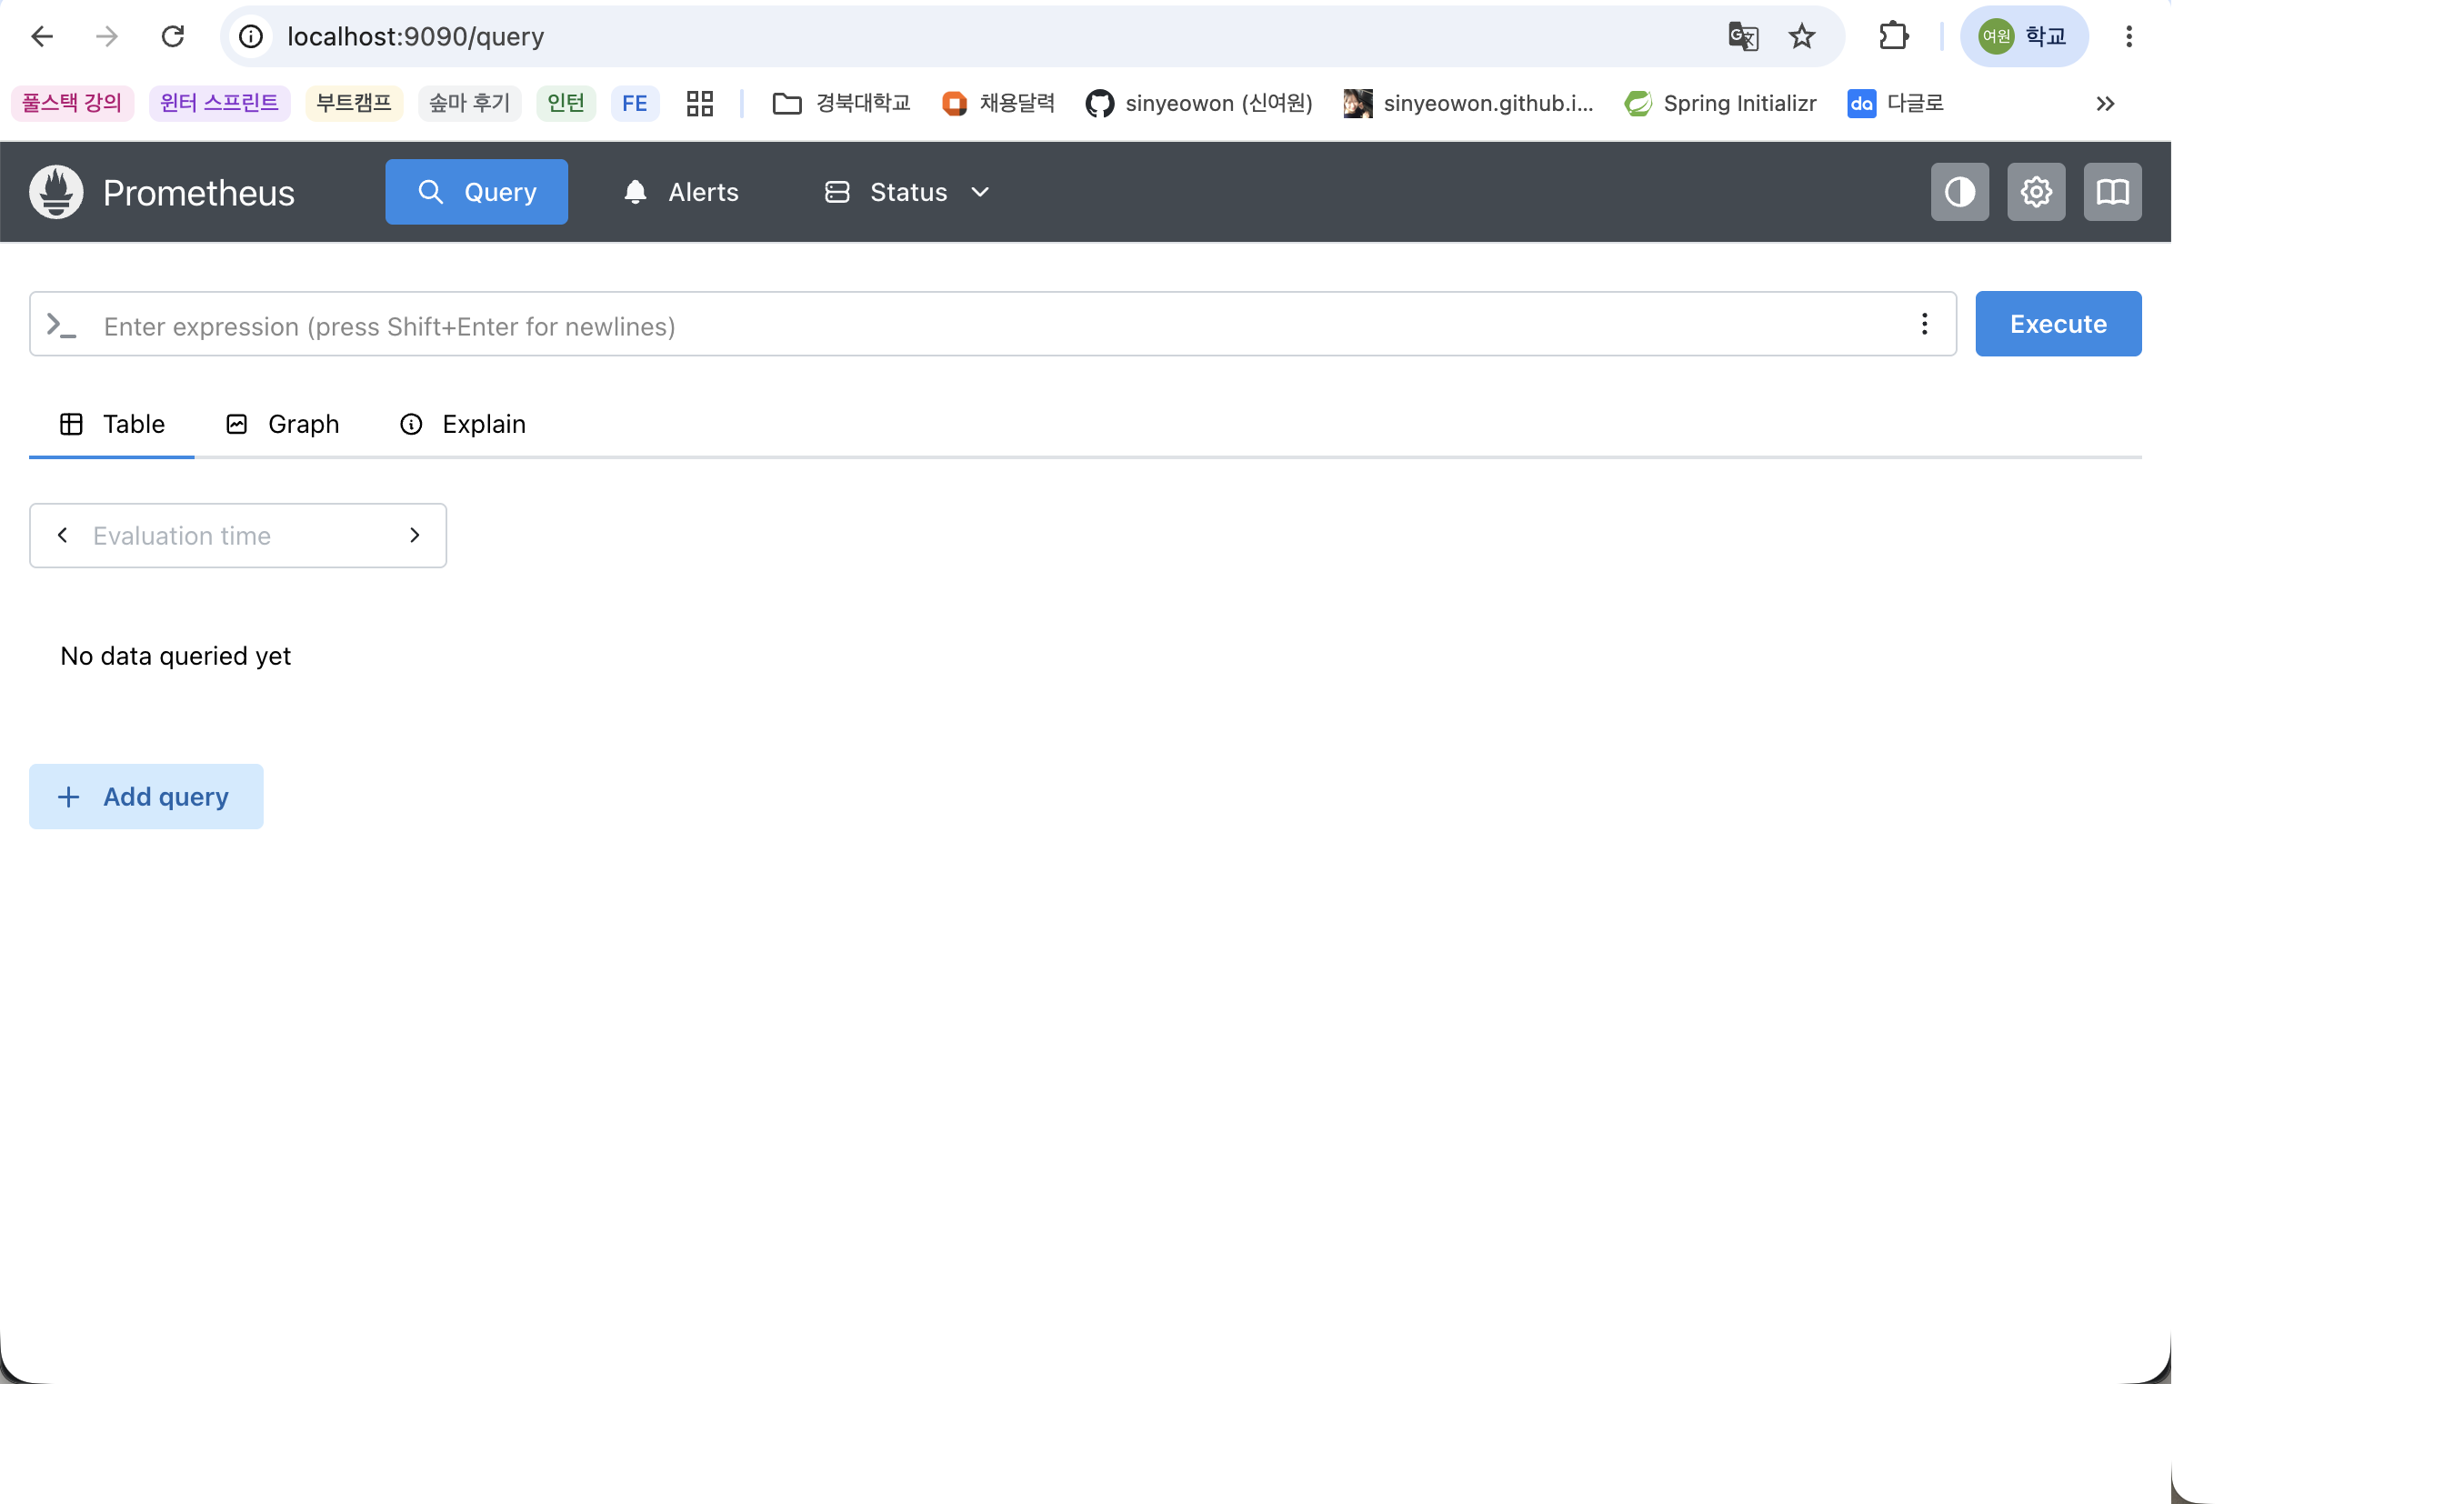
After running, connect to the following address.
1
http://localhost:9090
You can check whether the Spring Boot application is being collected normally by going to Status > Targets in the Prometheus menu.
Prometheus main screen
Screen showing spring-boot status as UP in
Status > Targets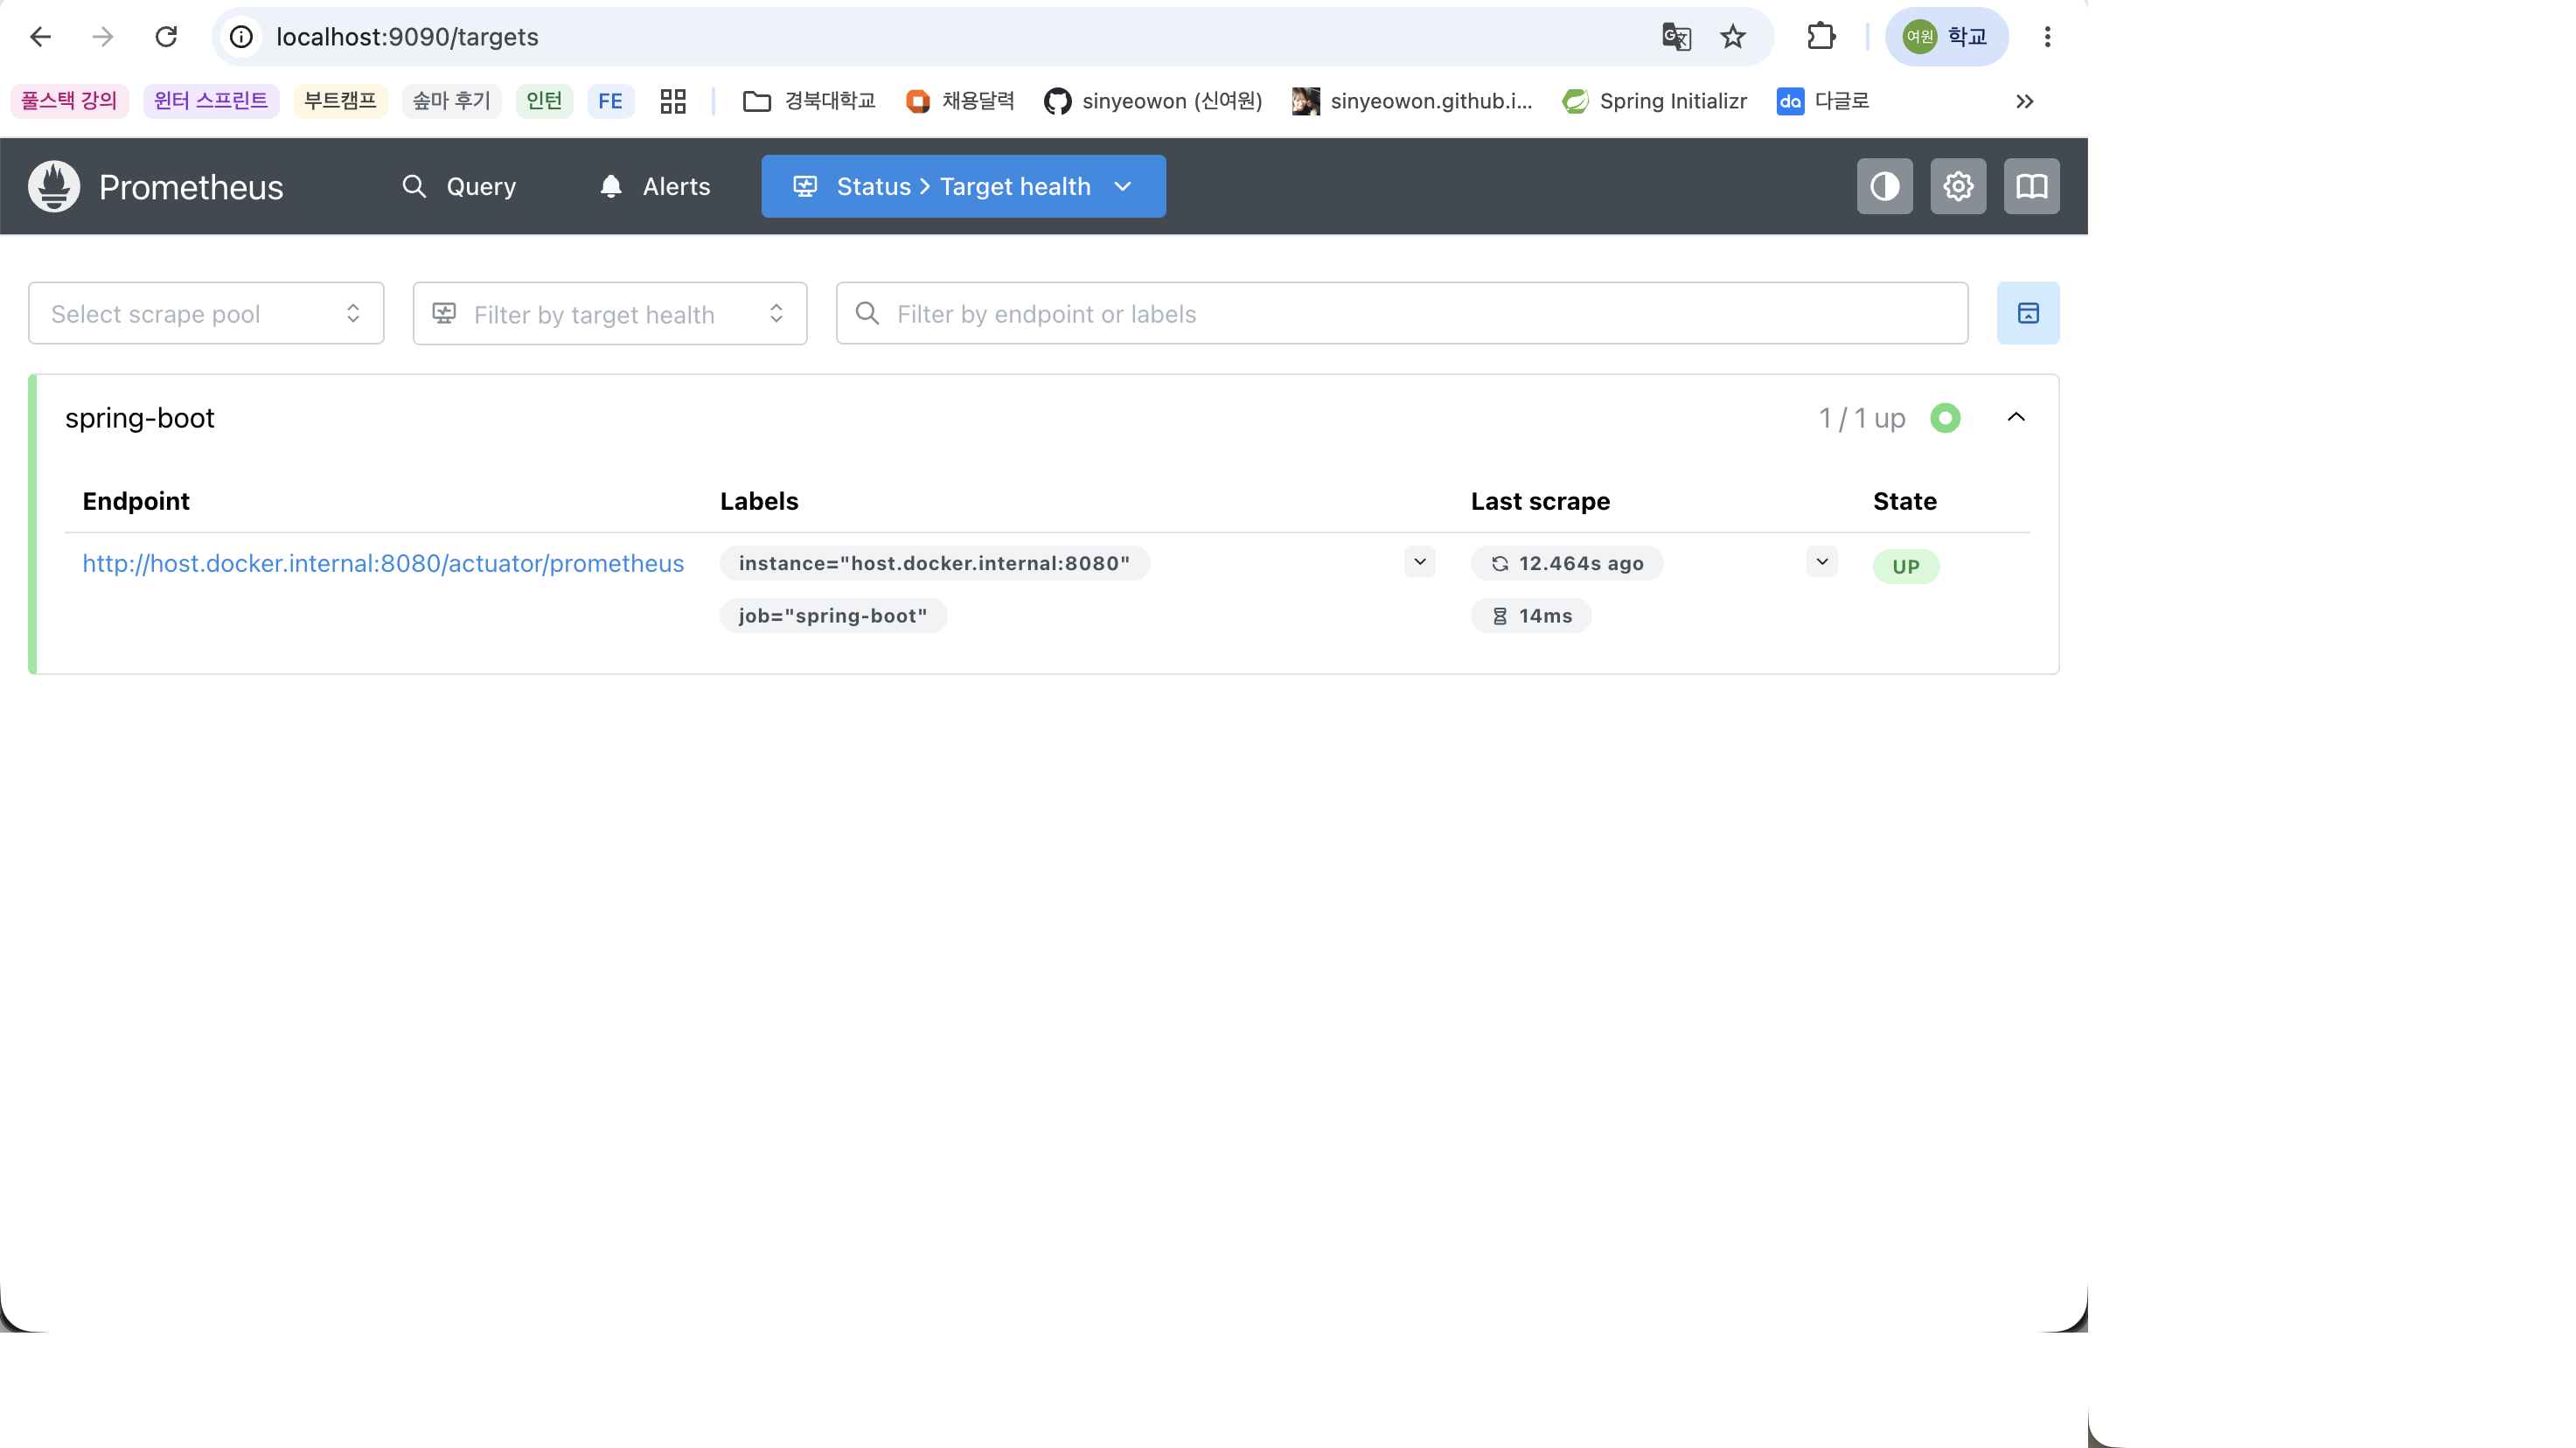
Grafana
What is Grafana?
Grafana is an open source dashboard tool that allows you to visualize and monitor data.
You can connect various data sources such as Prometheus, Loki, MySQL, and PostgreSQL.
While Prometheus collects and stores metric data, Grafana displays the data in graphs and dashboards that are easy for people to see.
Why you need Grafana
You can run queries and view metrics in Prometheus, but the dashboard form is much more convenient for continuously observing the operating system.
Using Grafana, you can check CPU usage, memory usage, number of requests, number of errors, etc. in graphs and charts, and can also send notifications when certain conditions occur.
In other words, Grafana “makes monitoring data easier to view.”
Run Grafana
Run the Grafana container with Docker.
1
2
3
4
docker run -d \
  --name=grafana \
  - p 3000:3000 \
  grafana/grafana
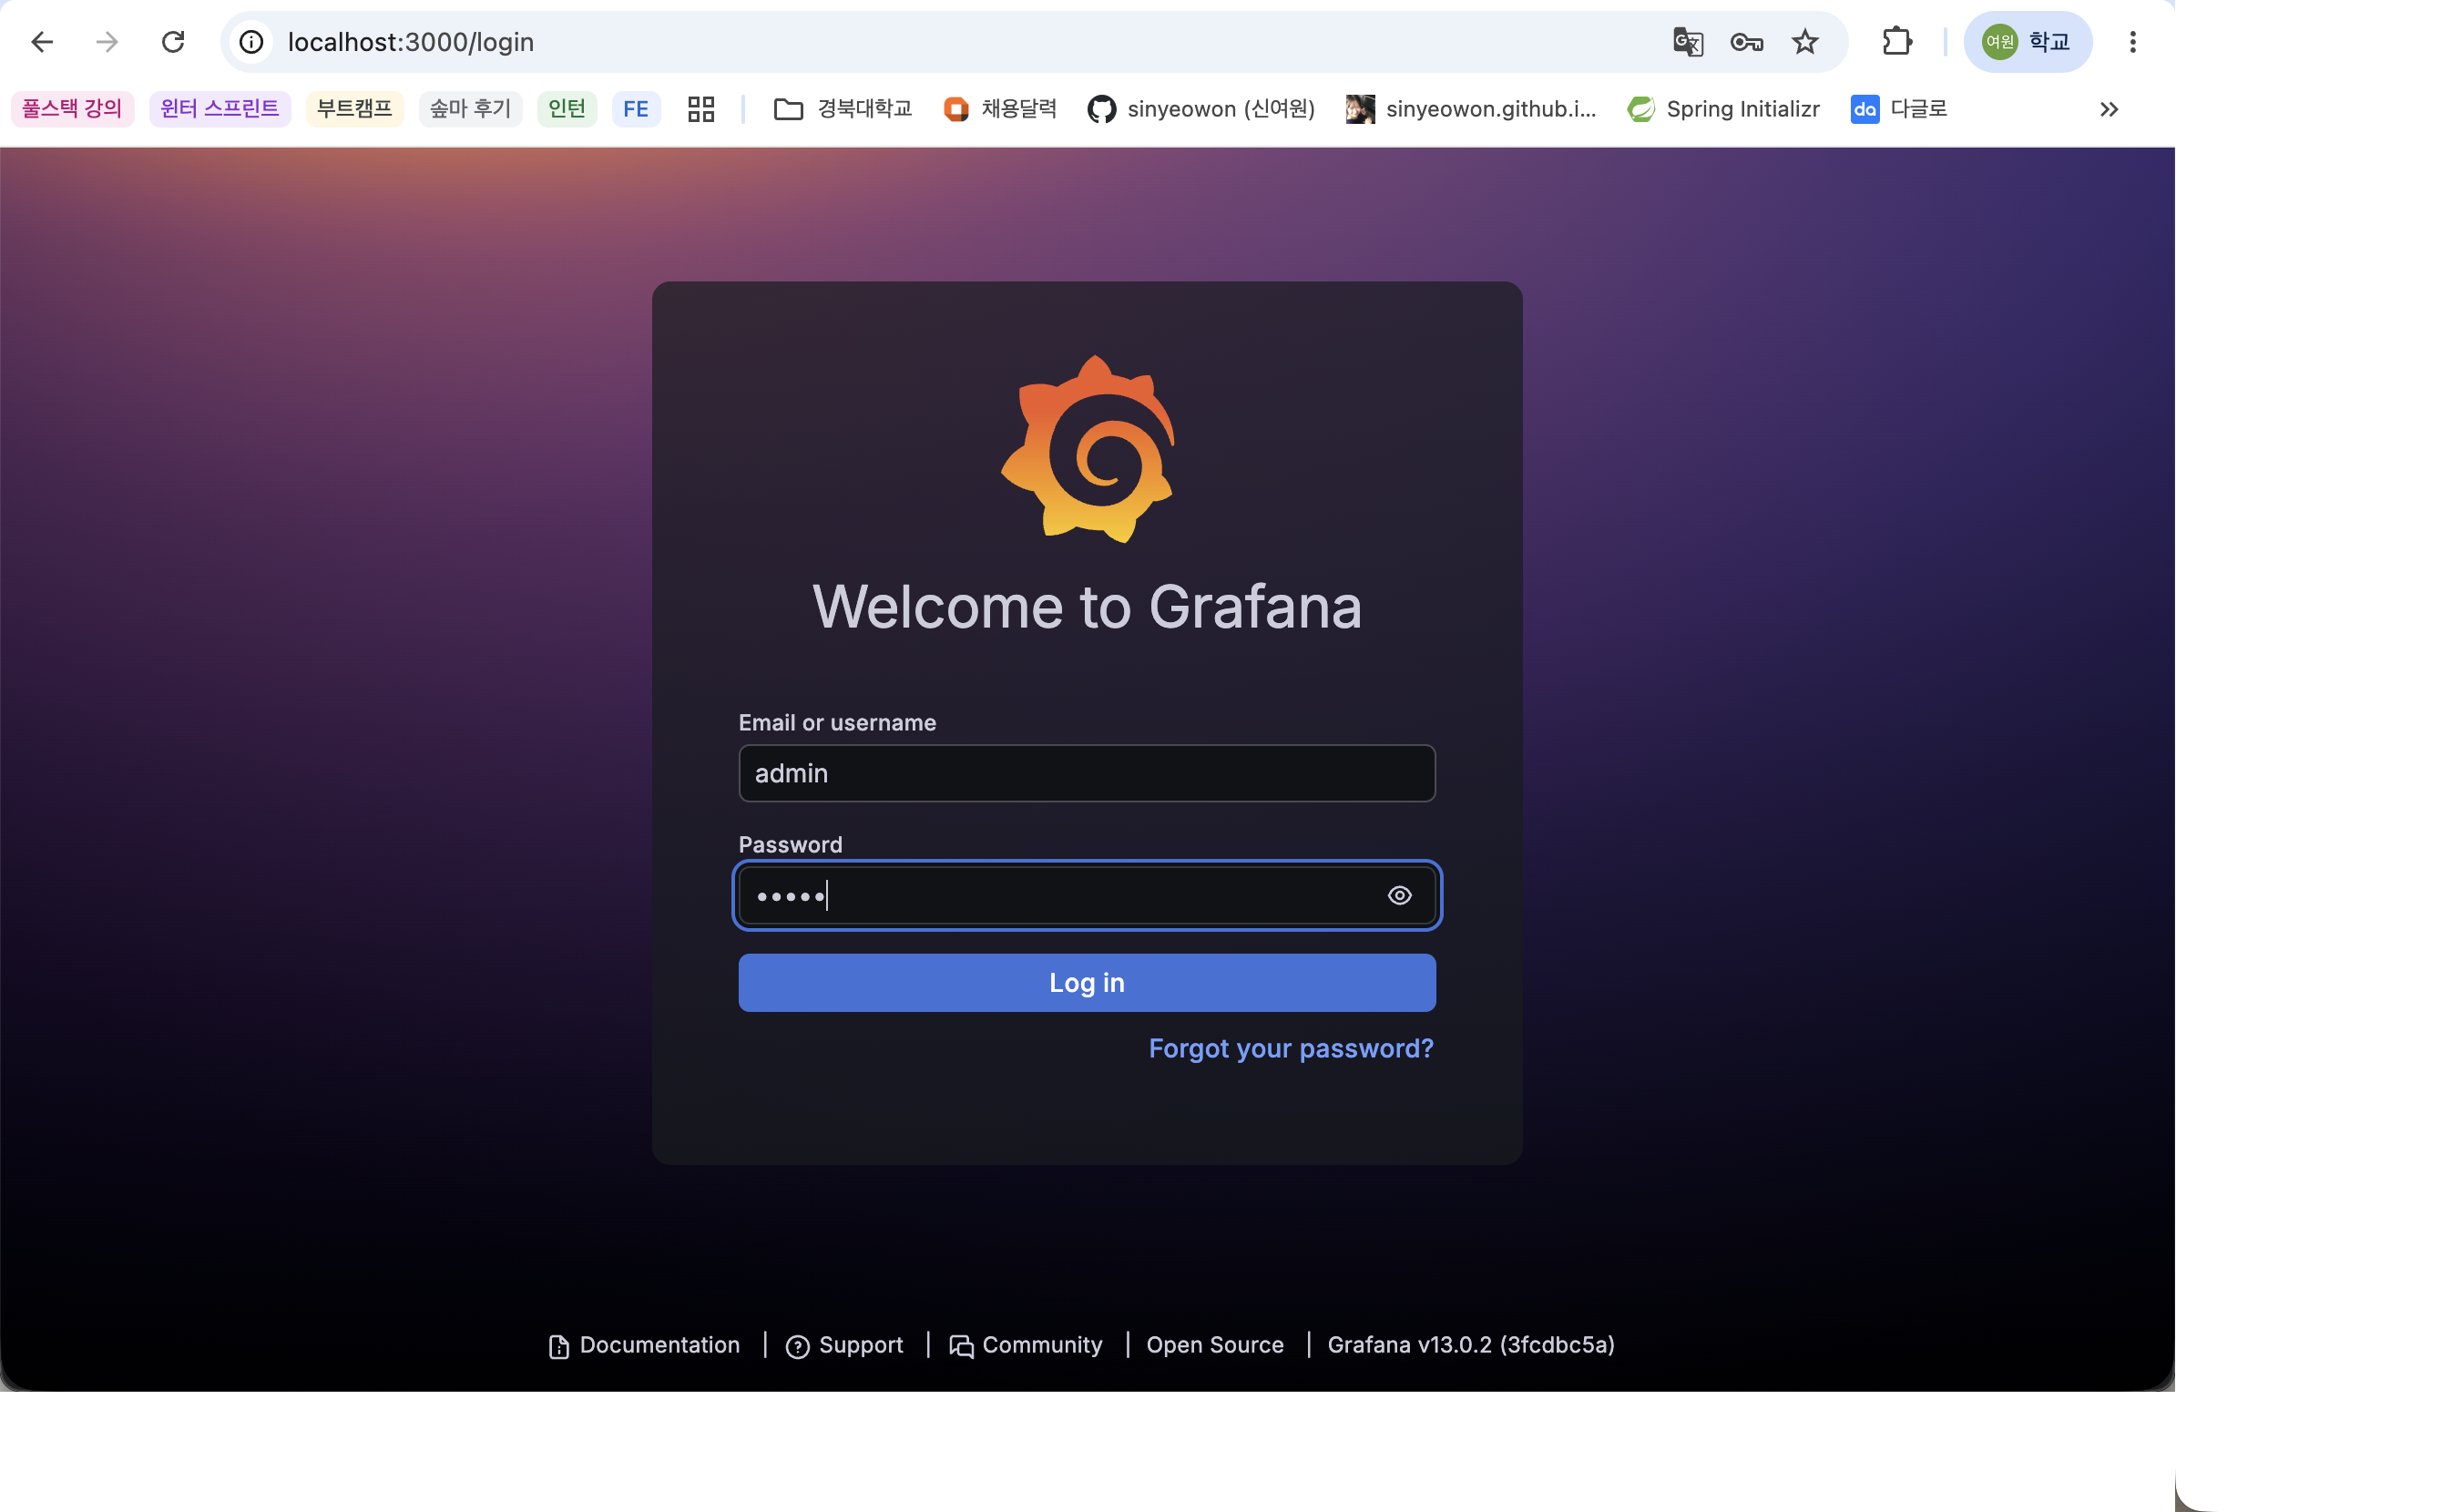
Access the following address in your browser.
1
http://localhost:3000
The basic account is as follows.
1
2
ID: admin
Password: admin
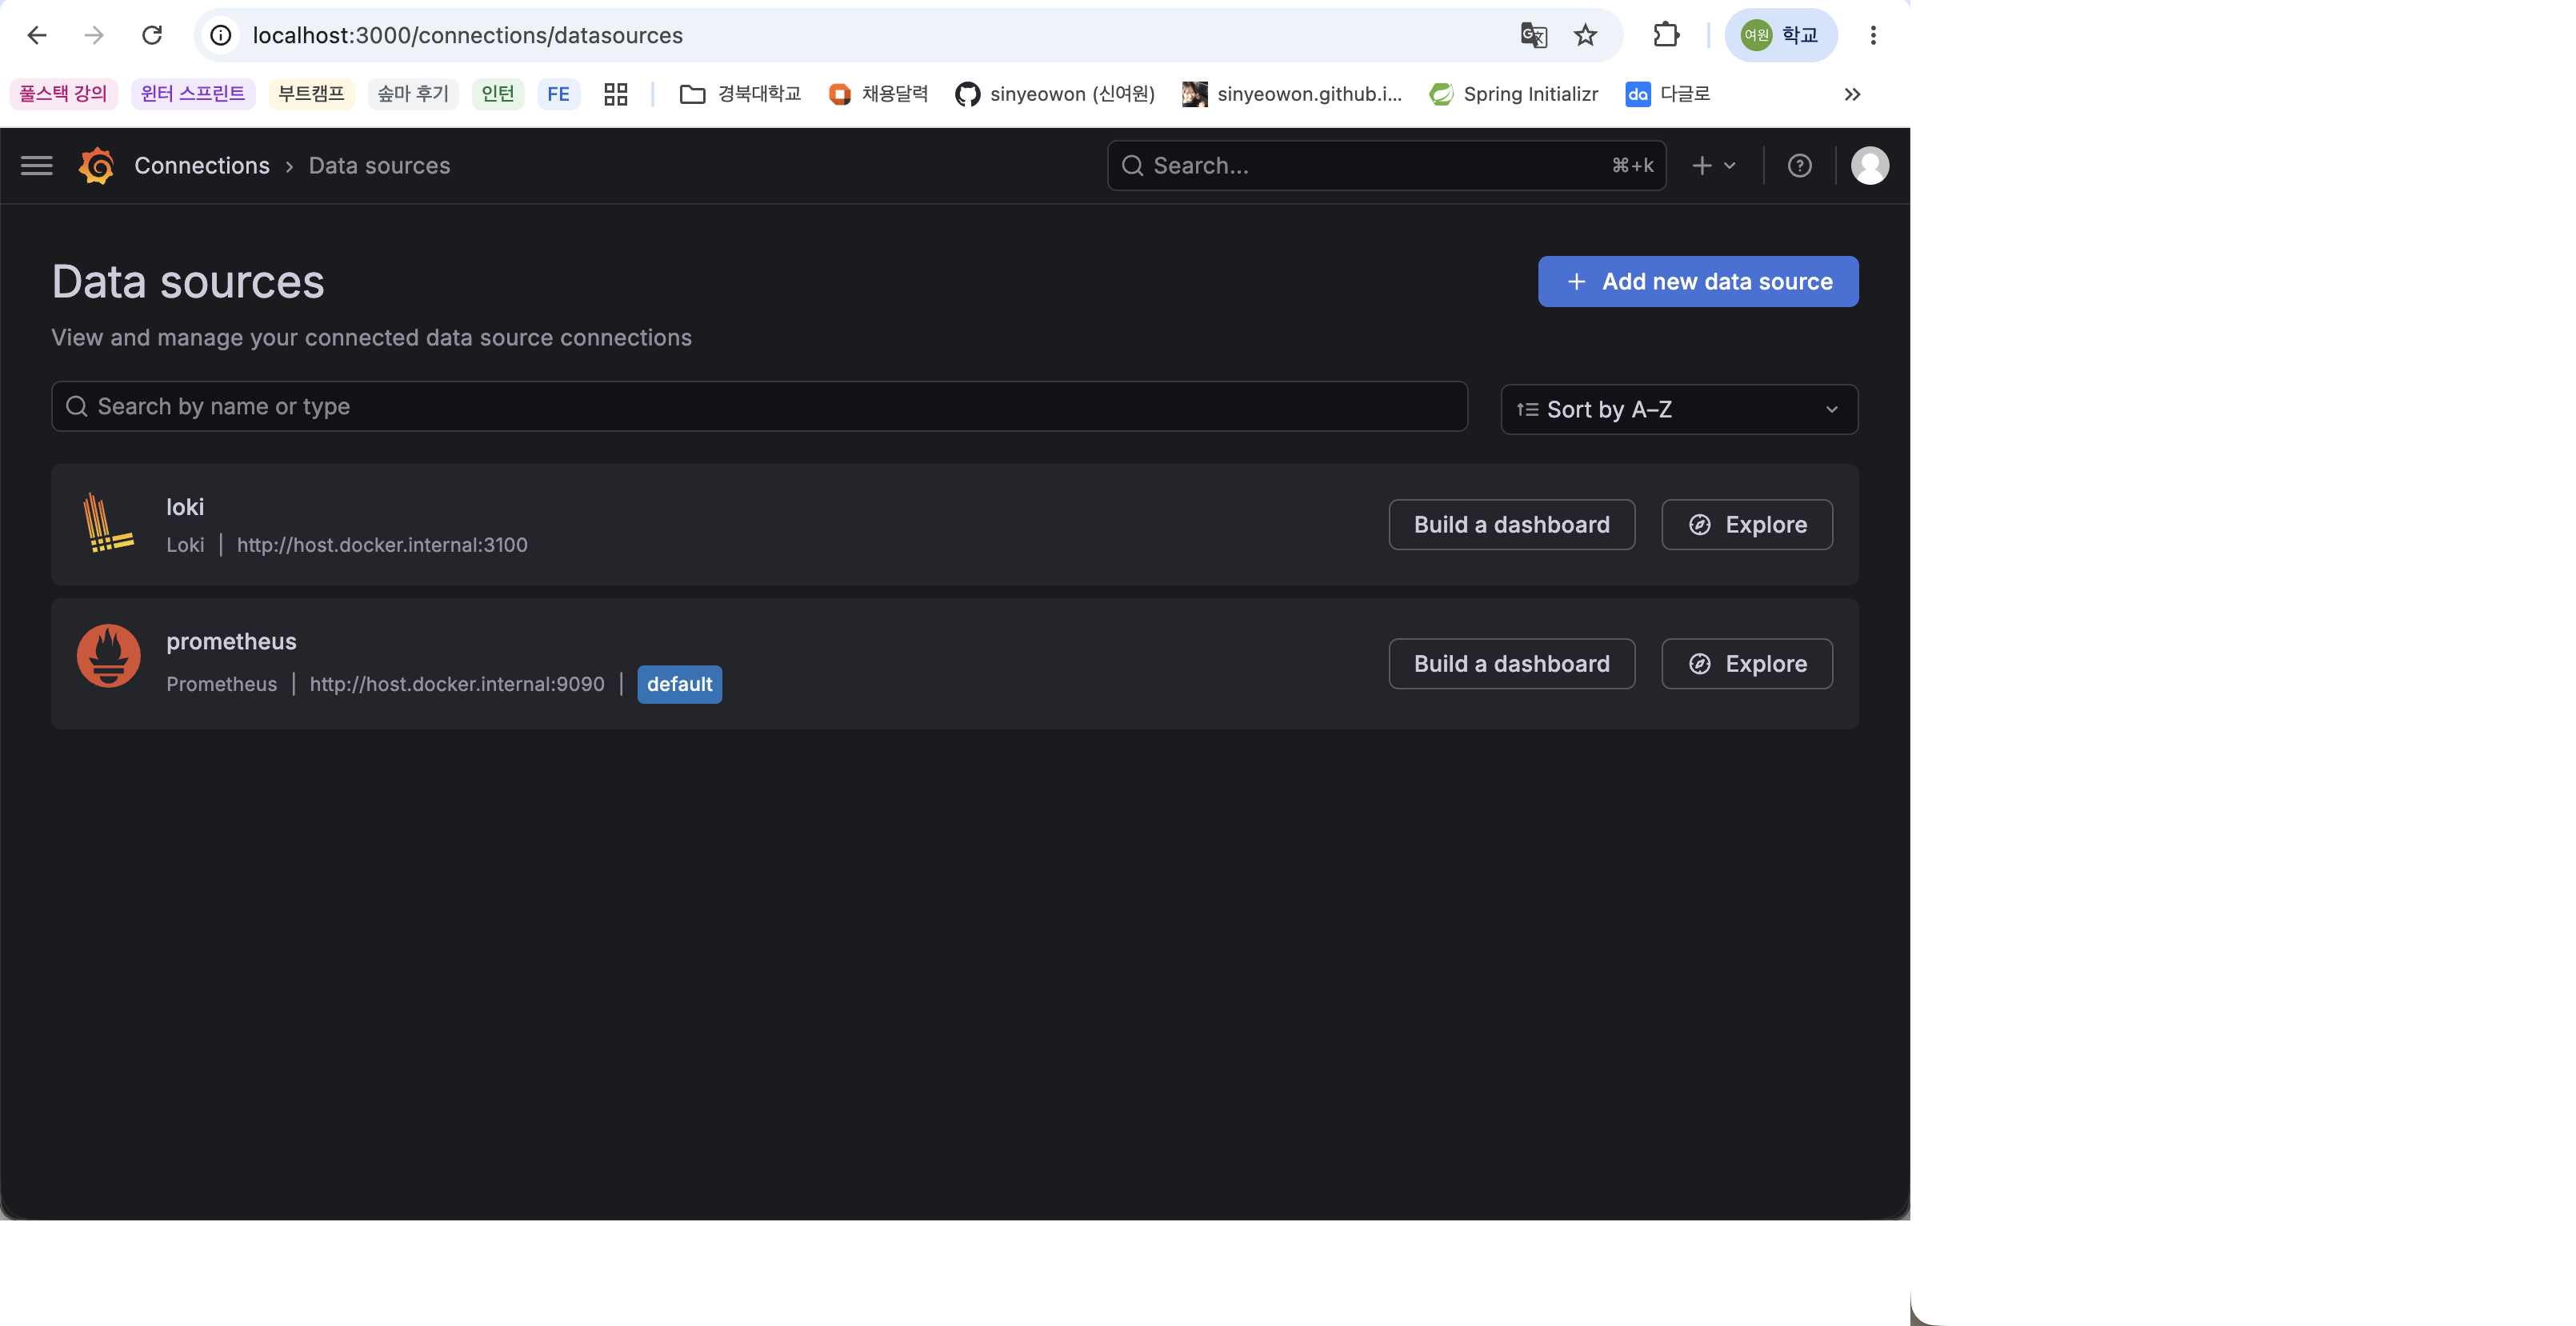
Prometheus data source connection
To use Prometheus data in Grafana, you must add a data source.
The setting sequence is as follows.
Access Grafana
Move to Data sources menu
Choose Prometheus
Enter Prometheus server URL
Click Save & test
Since Prometheus is running with Docker, the URL can be entered as follows:
1
http://host.docker.internal:9090
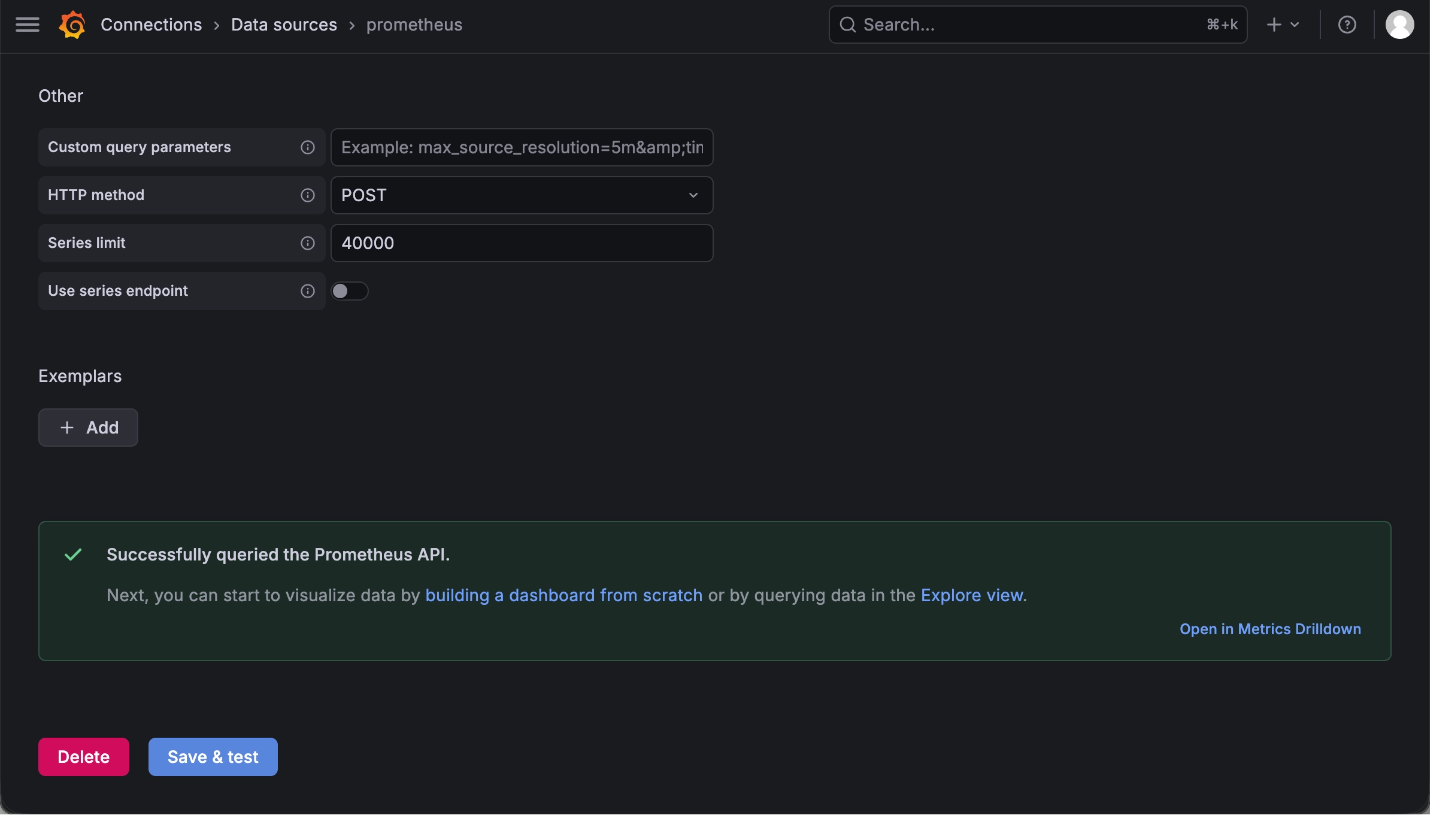
If the connection is successful, you can view Prometheus data in Grafana.
Grafana login screen
Prometheus Data source setting screen
Save & test success screen
Dashboard Import
In Grafana, you can import and use already created dashboards.
Entered and imported 19004 into the dashboard for Spring Boot 3.
The dashboard import flow is as follows.
Go to Dashboards menu
Select New or Import dashboard
Enter Dashboard ID
19004Click Load
Select Prometheus data source
Click Import
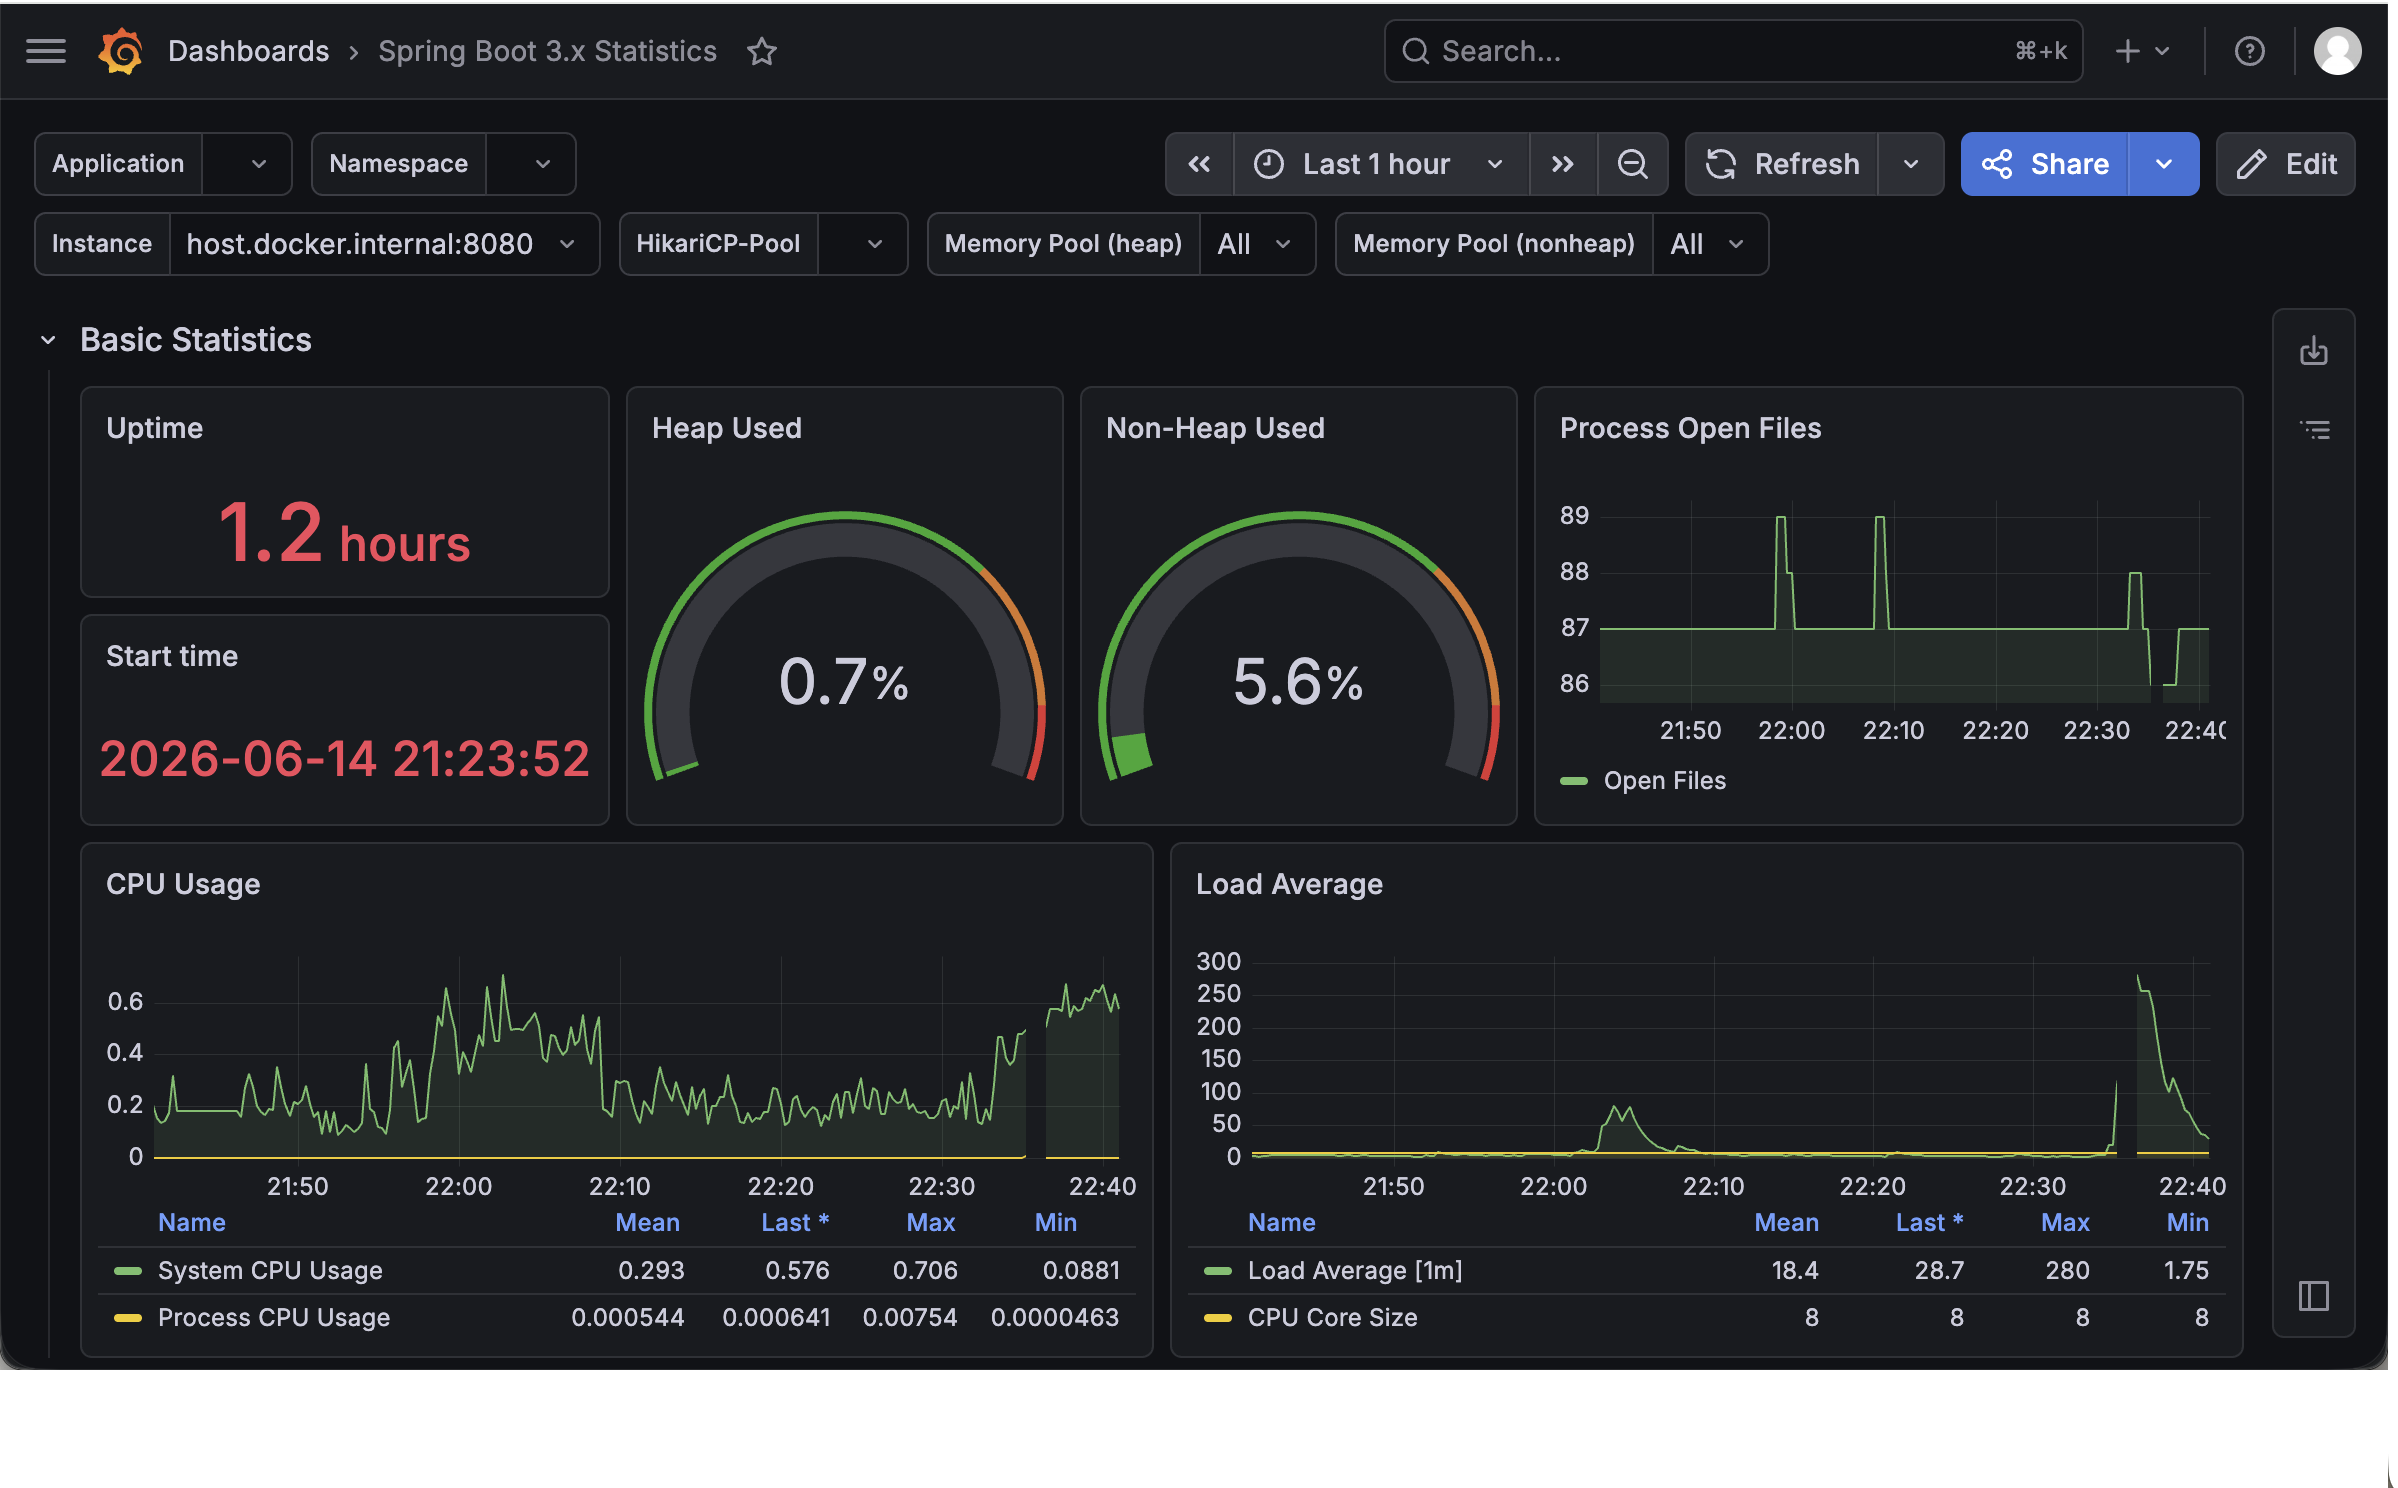
- Spring Boot dashboard creation result screen
Send Alert from Grafana to Slack
What is Alert?
Alert is a function that sends a notification when certain conditions are met.
For example, when a Spring Boot application is stopped, the up metric value of Prometheus becomes 0, and Grafana can determine the failure state based on this value.
In this lab, we set up a notification to be sent to Slack when the Spring Boot application stops.### Why you need Slack Alerts
Developers can’t keep looking at the Grafana dashboard.
Because failures can occur at any time, it is important to be notified immediately through a collaboration tool like Slack when a problem occurs.
By setting up Slack Alert, team members can quickly recognize the situation and respond when an application goes down.
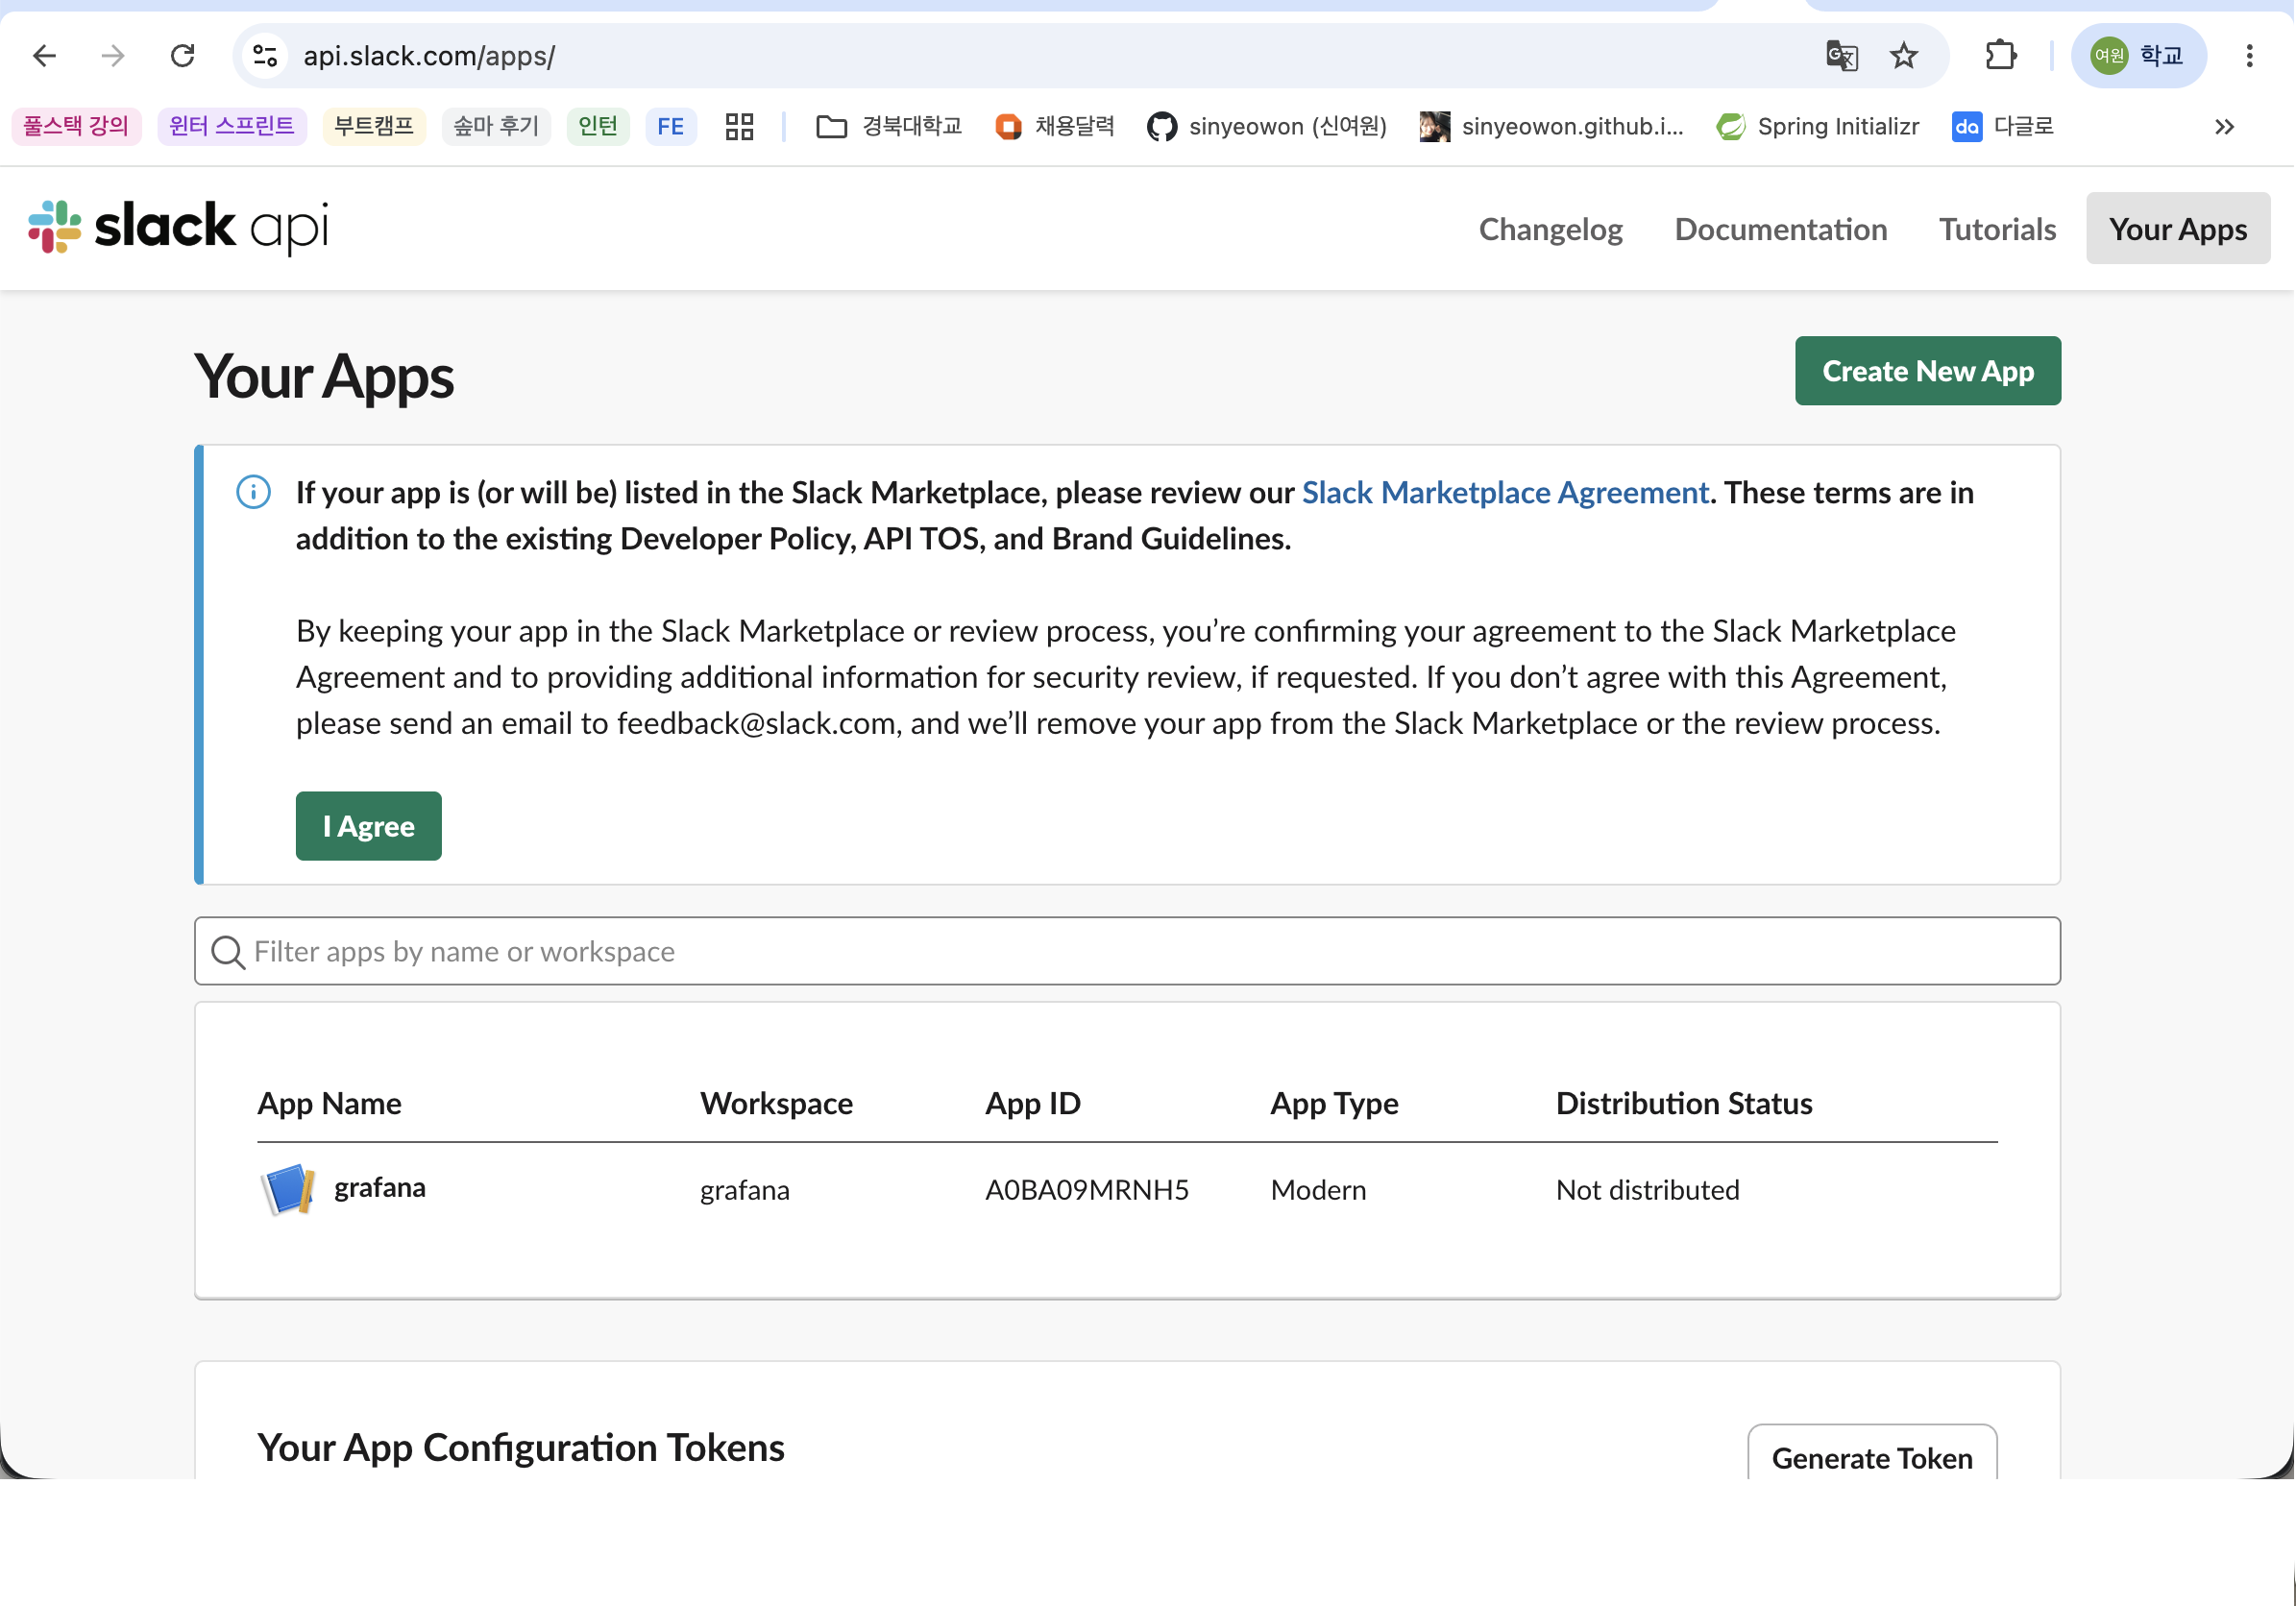
Slack App and Webhook Settings
Create an app in Slack API and activate Incoming Webhooks.
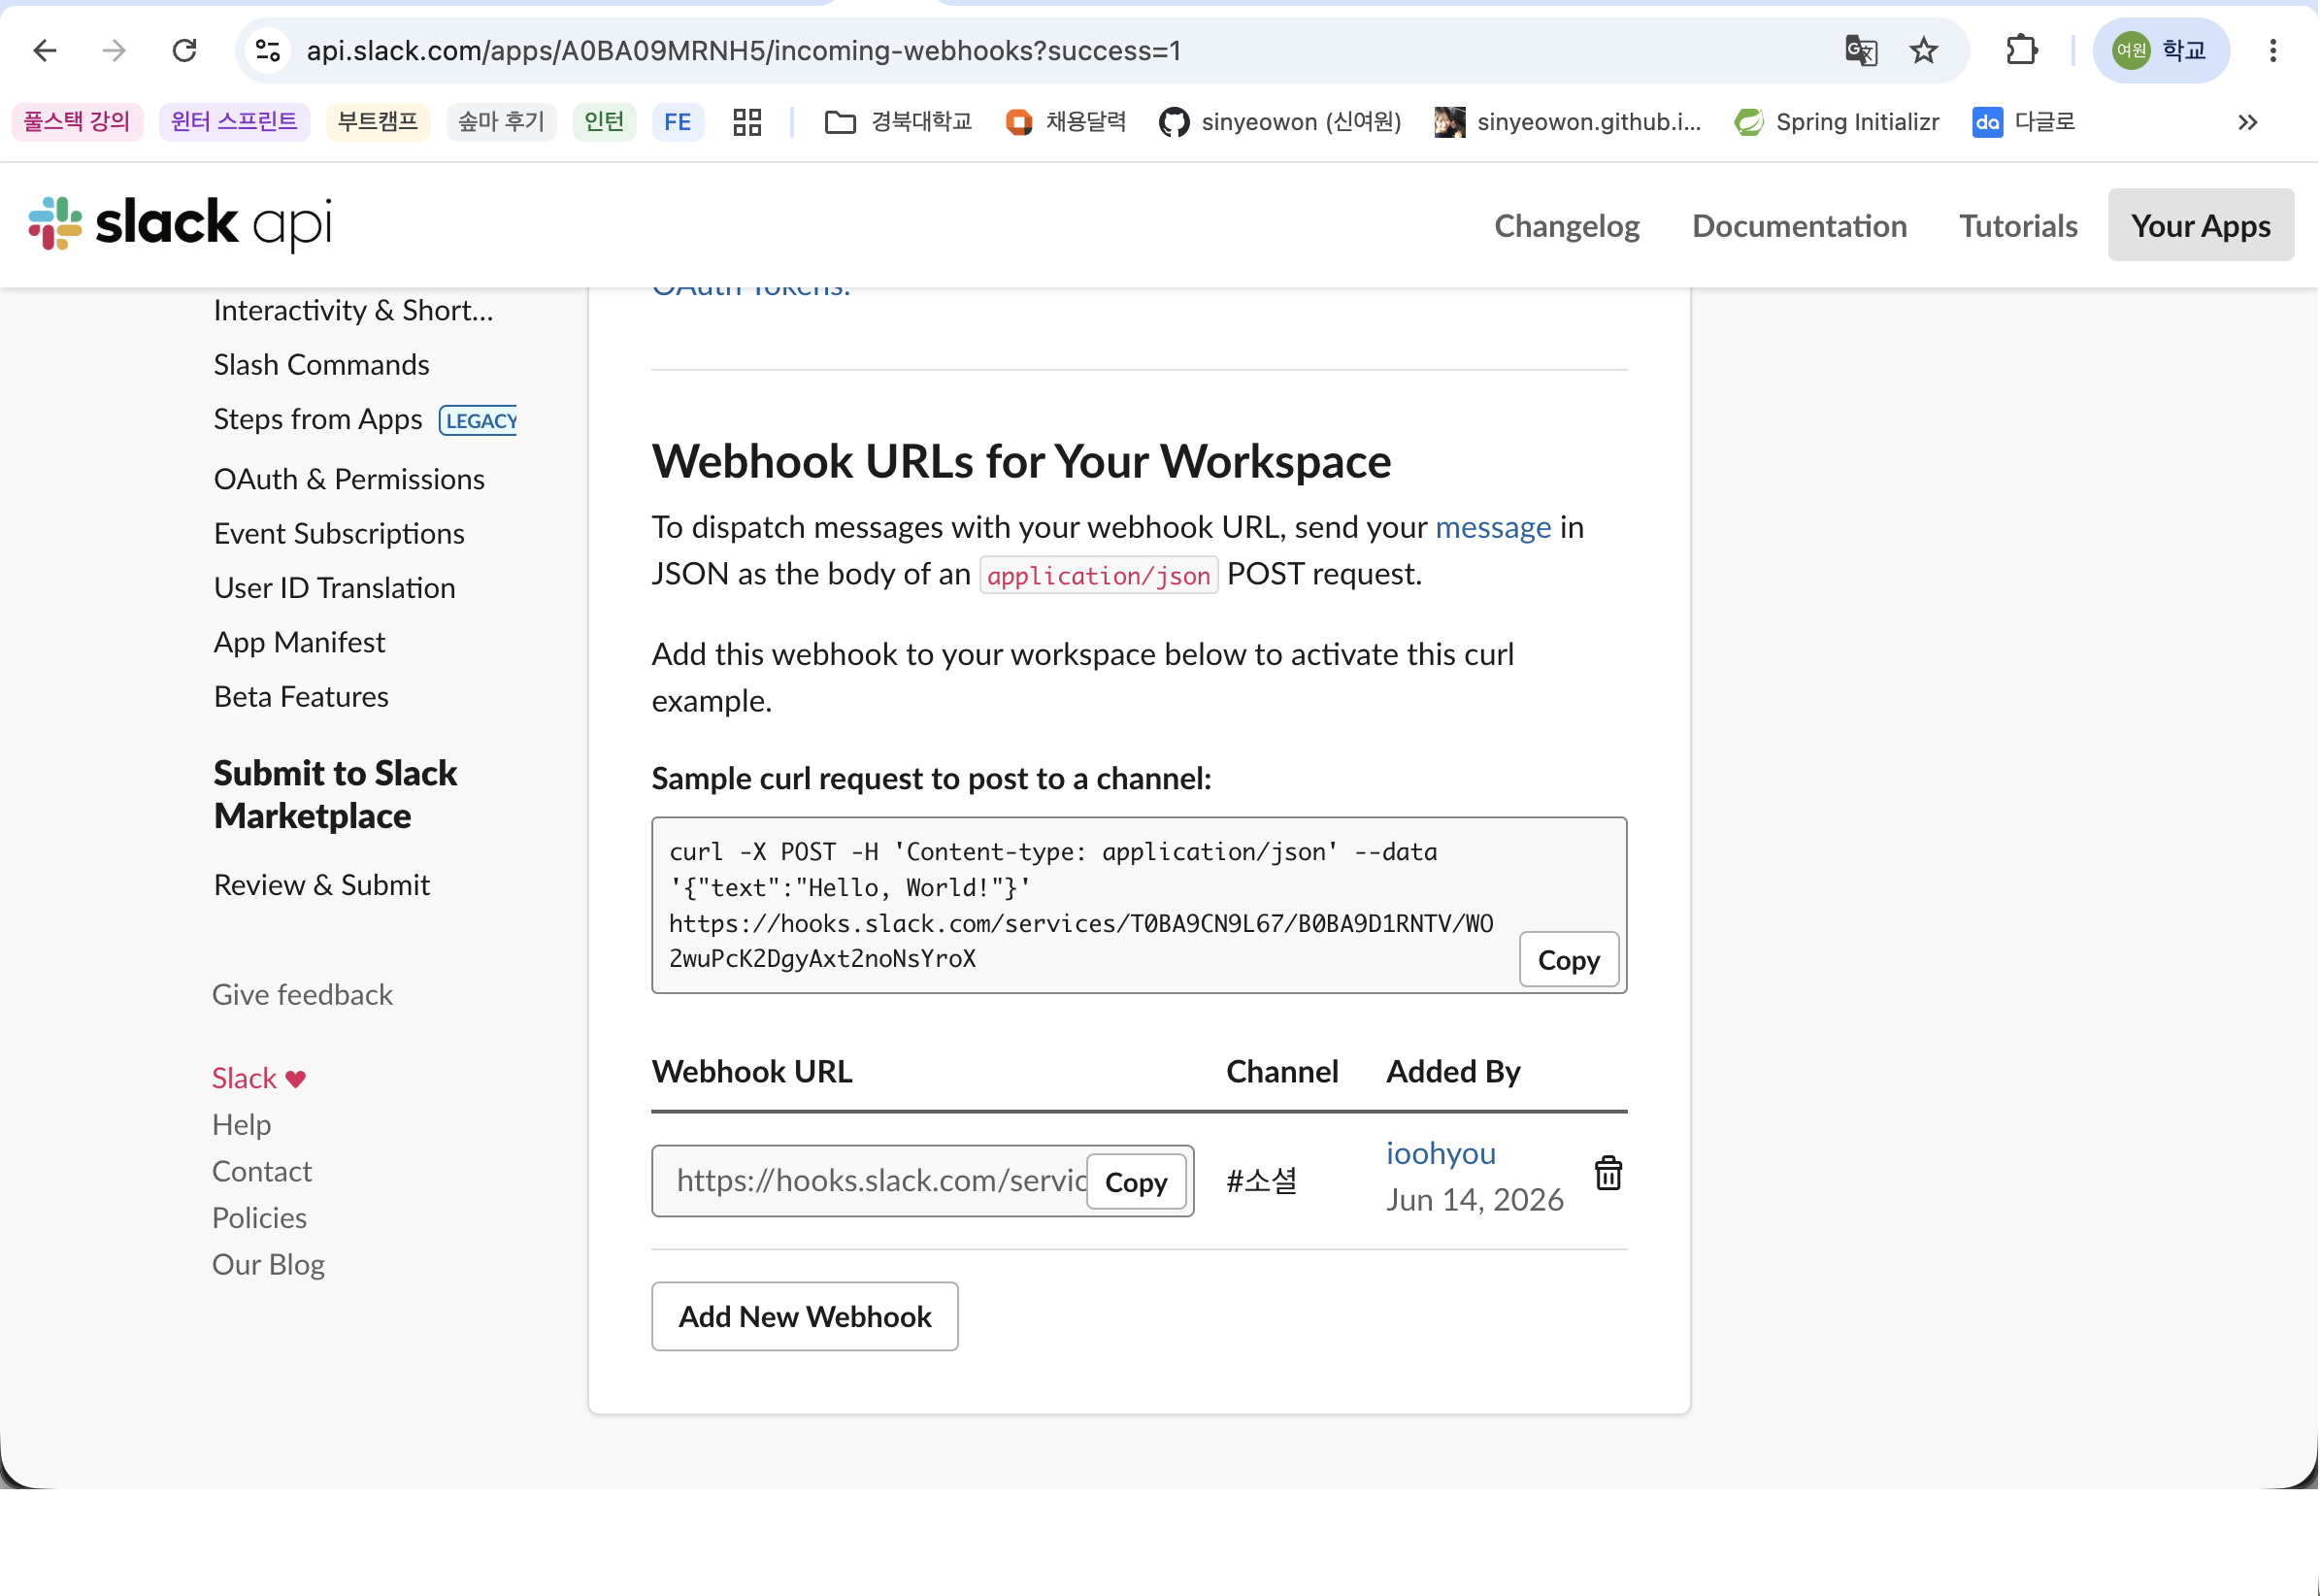
Then select the Slack channel to receive notifications and create a webhook URL.
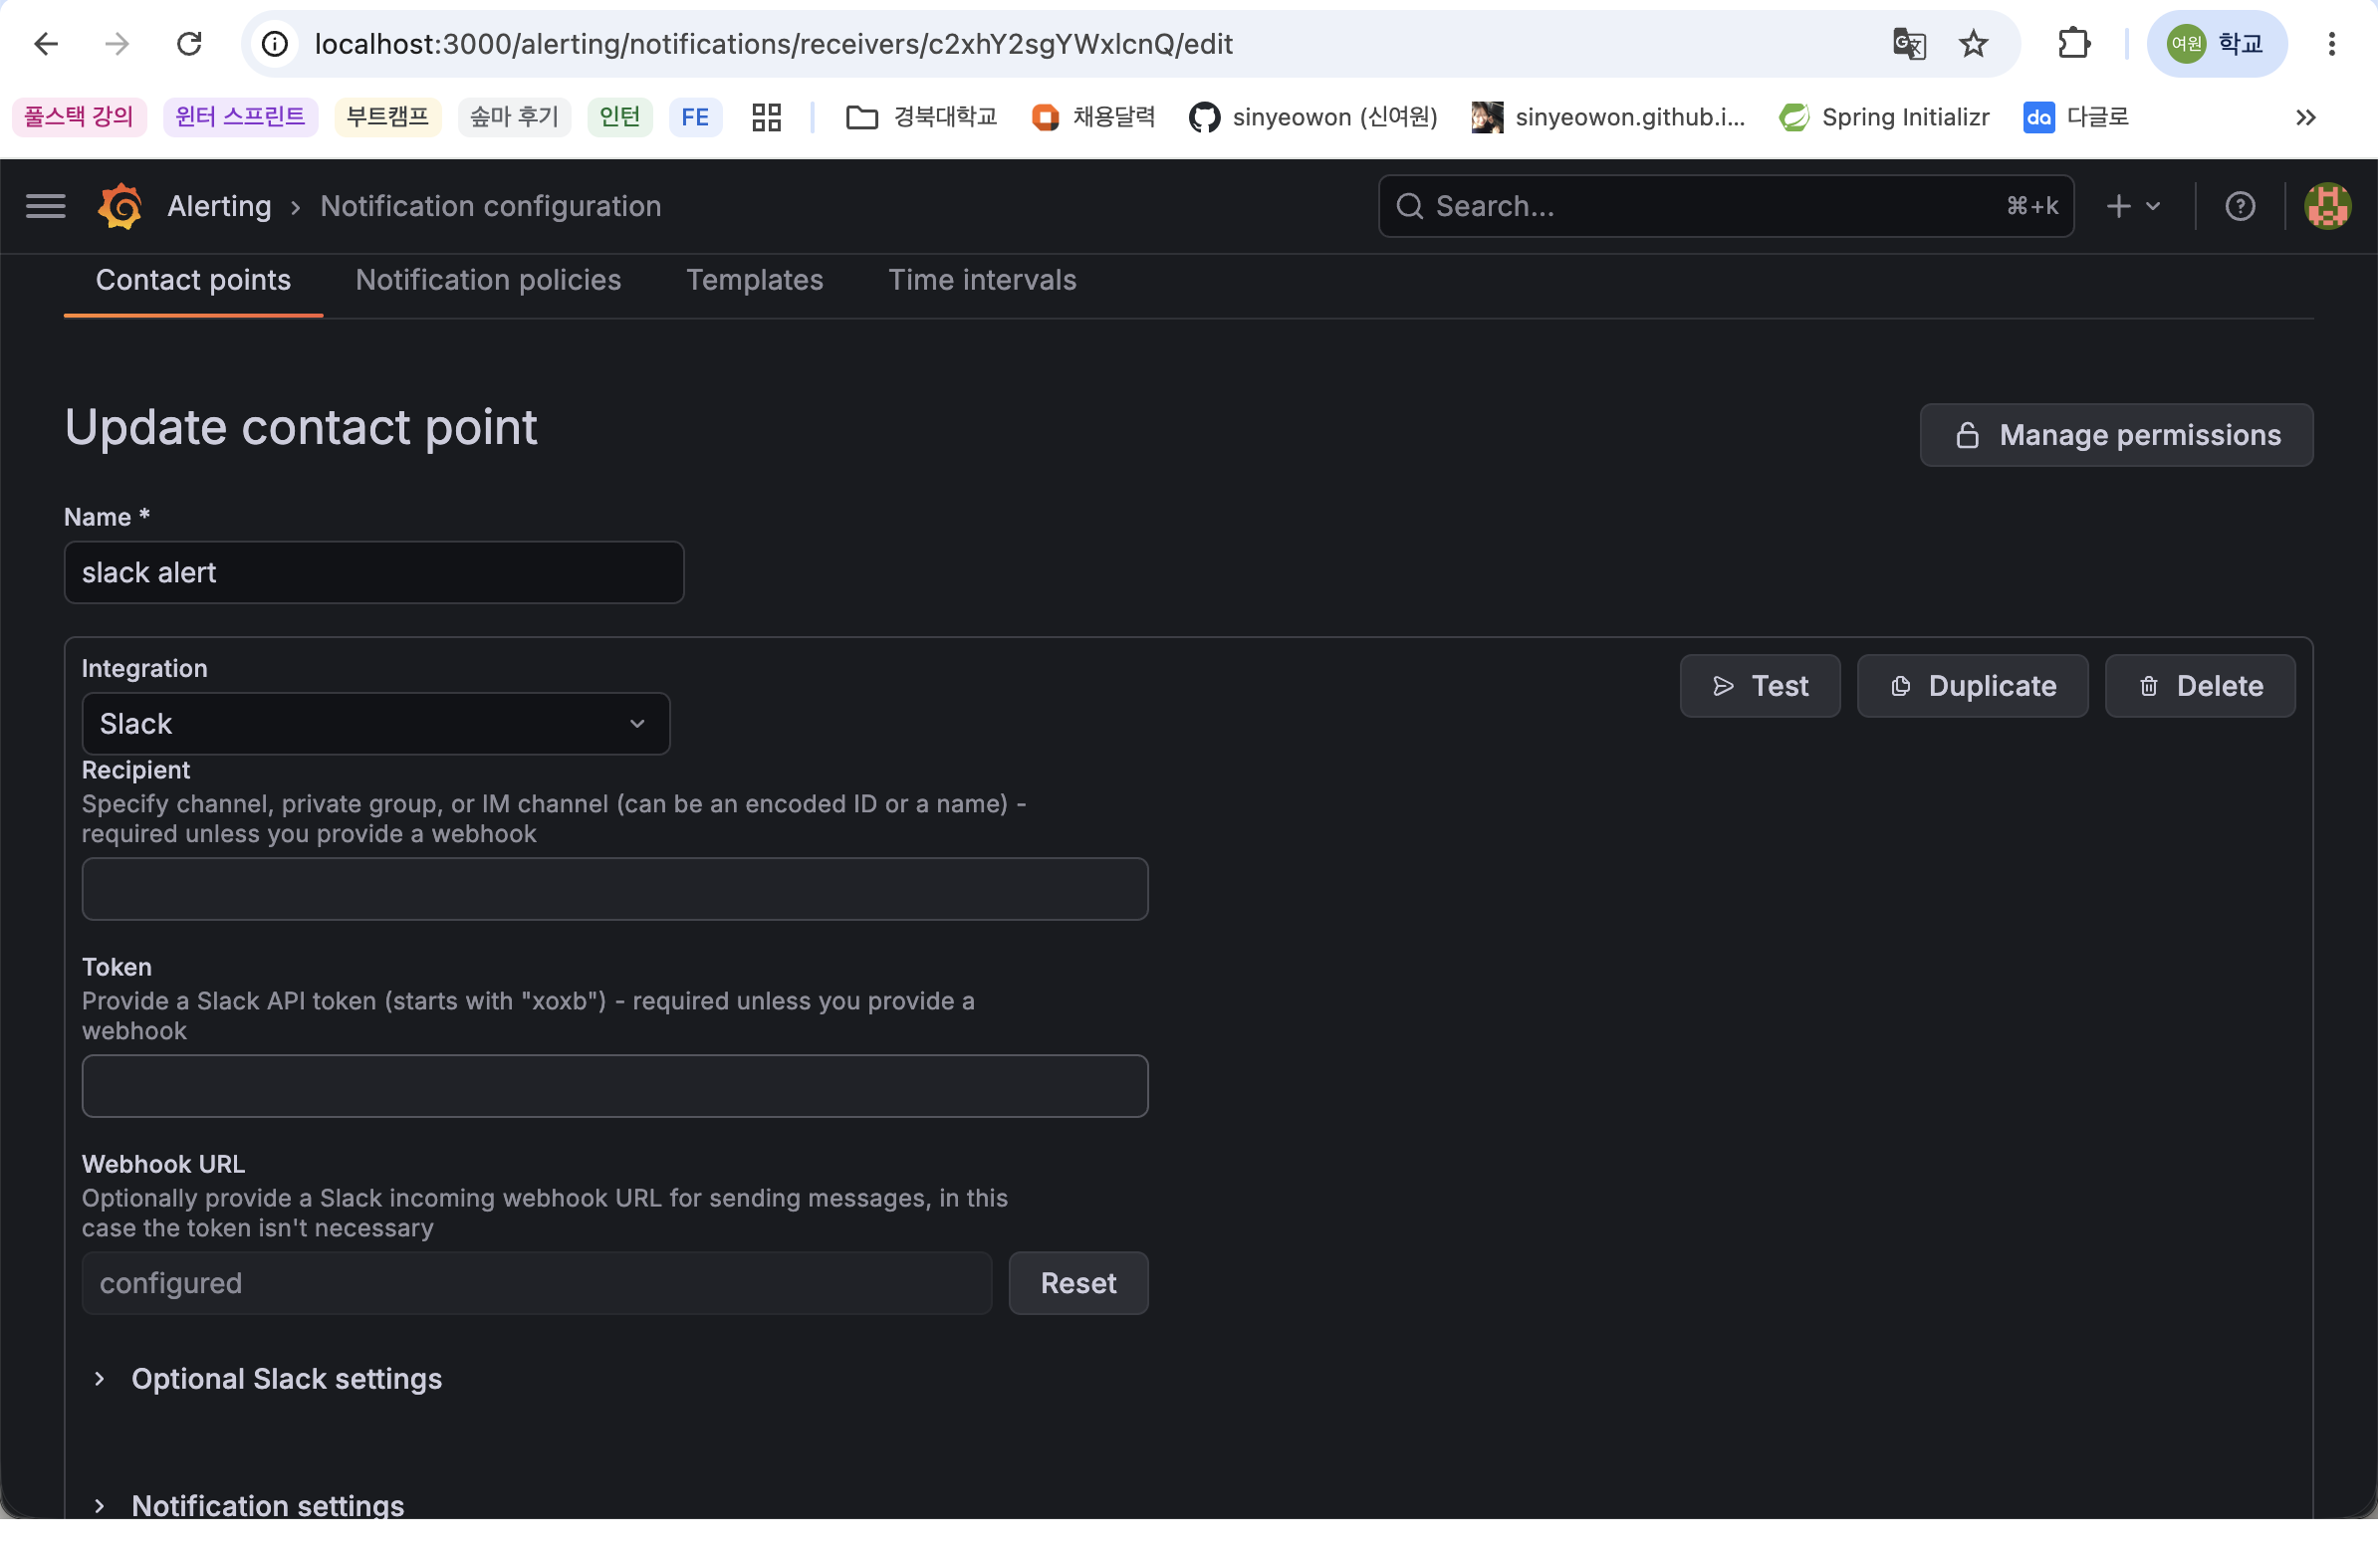
In Grafana, register this webhook URL in Contact point.
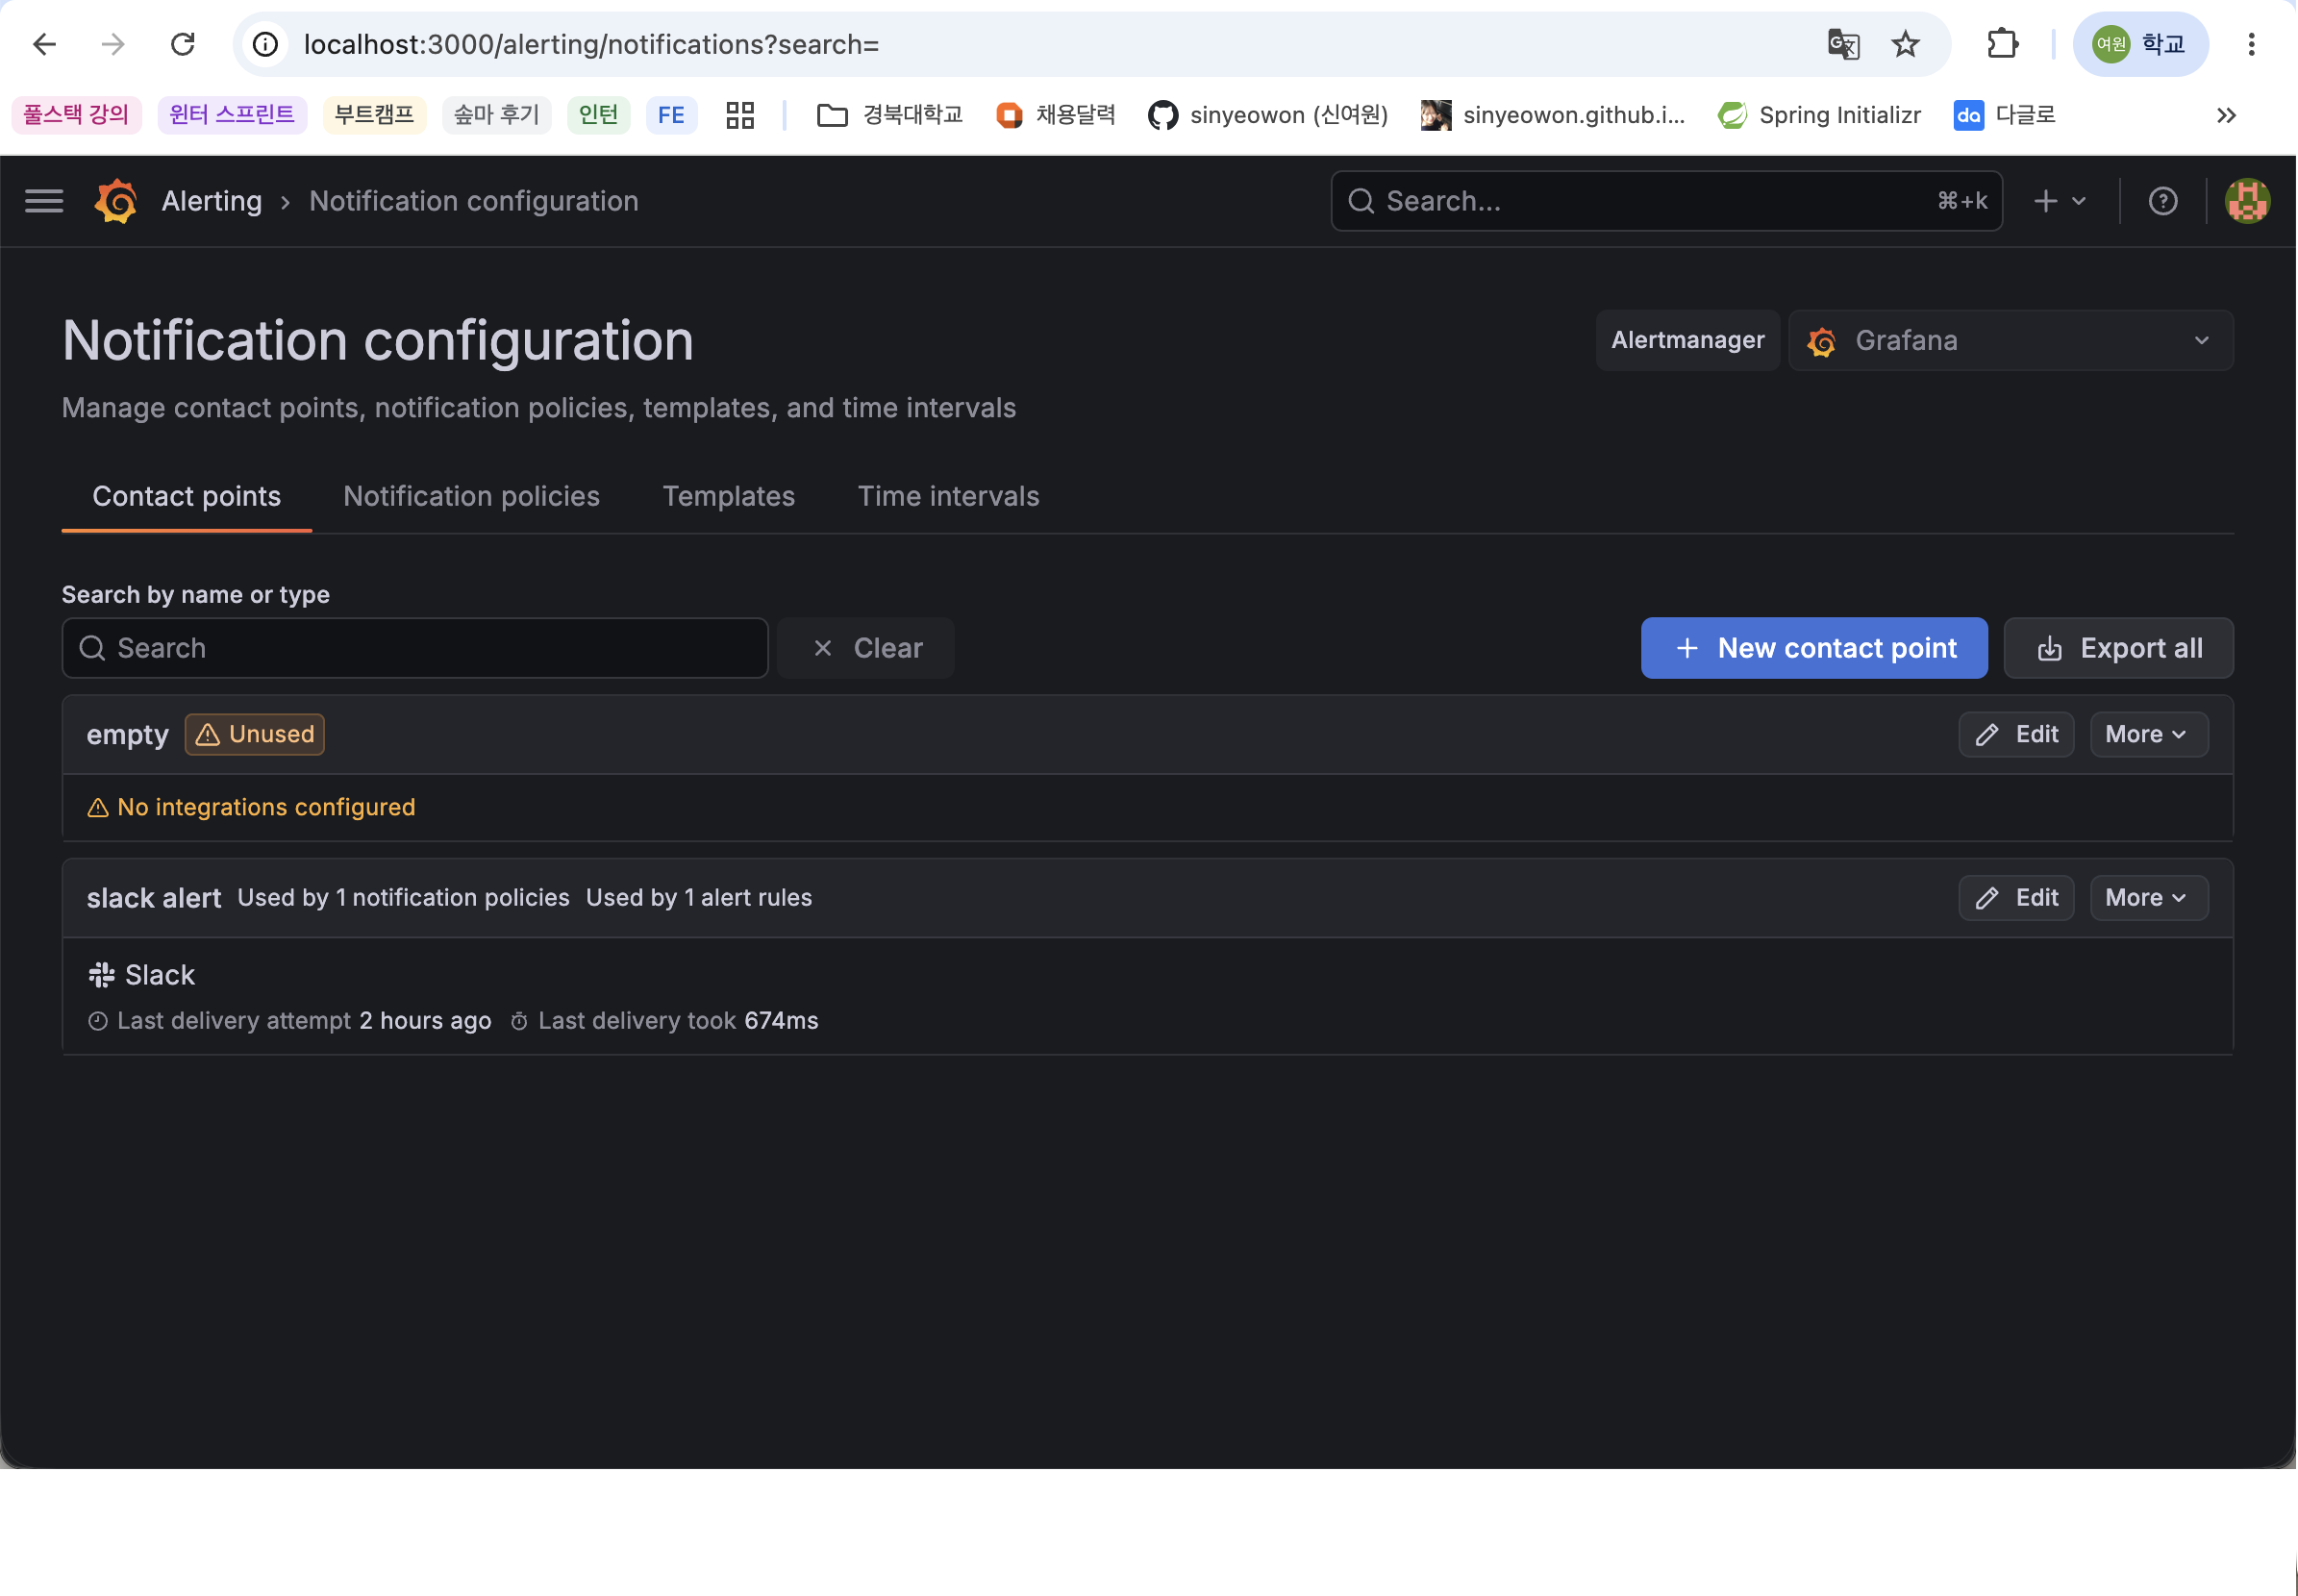
Grafana Contact point settings
Set in Grafana in the following order.
Move to Alerting menu
Select contact points
Click Add contact point
Select Integration as Slack
Enter Webhook URL
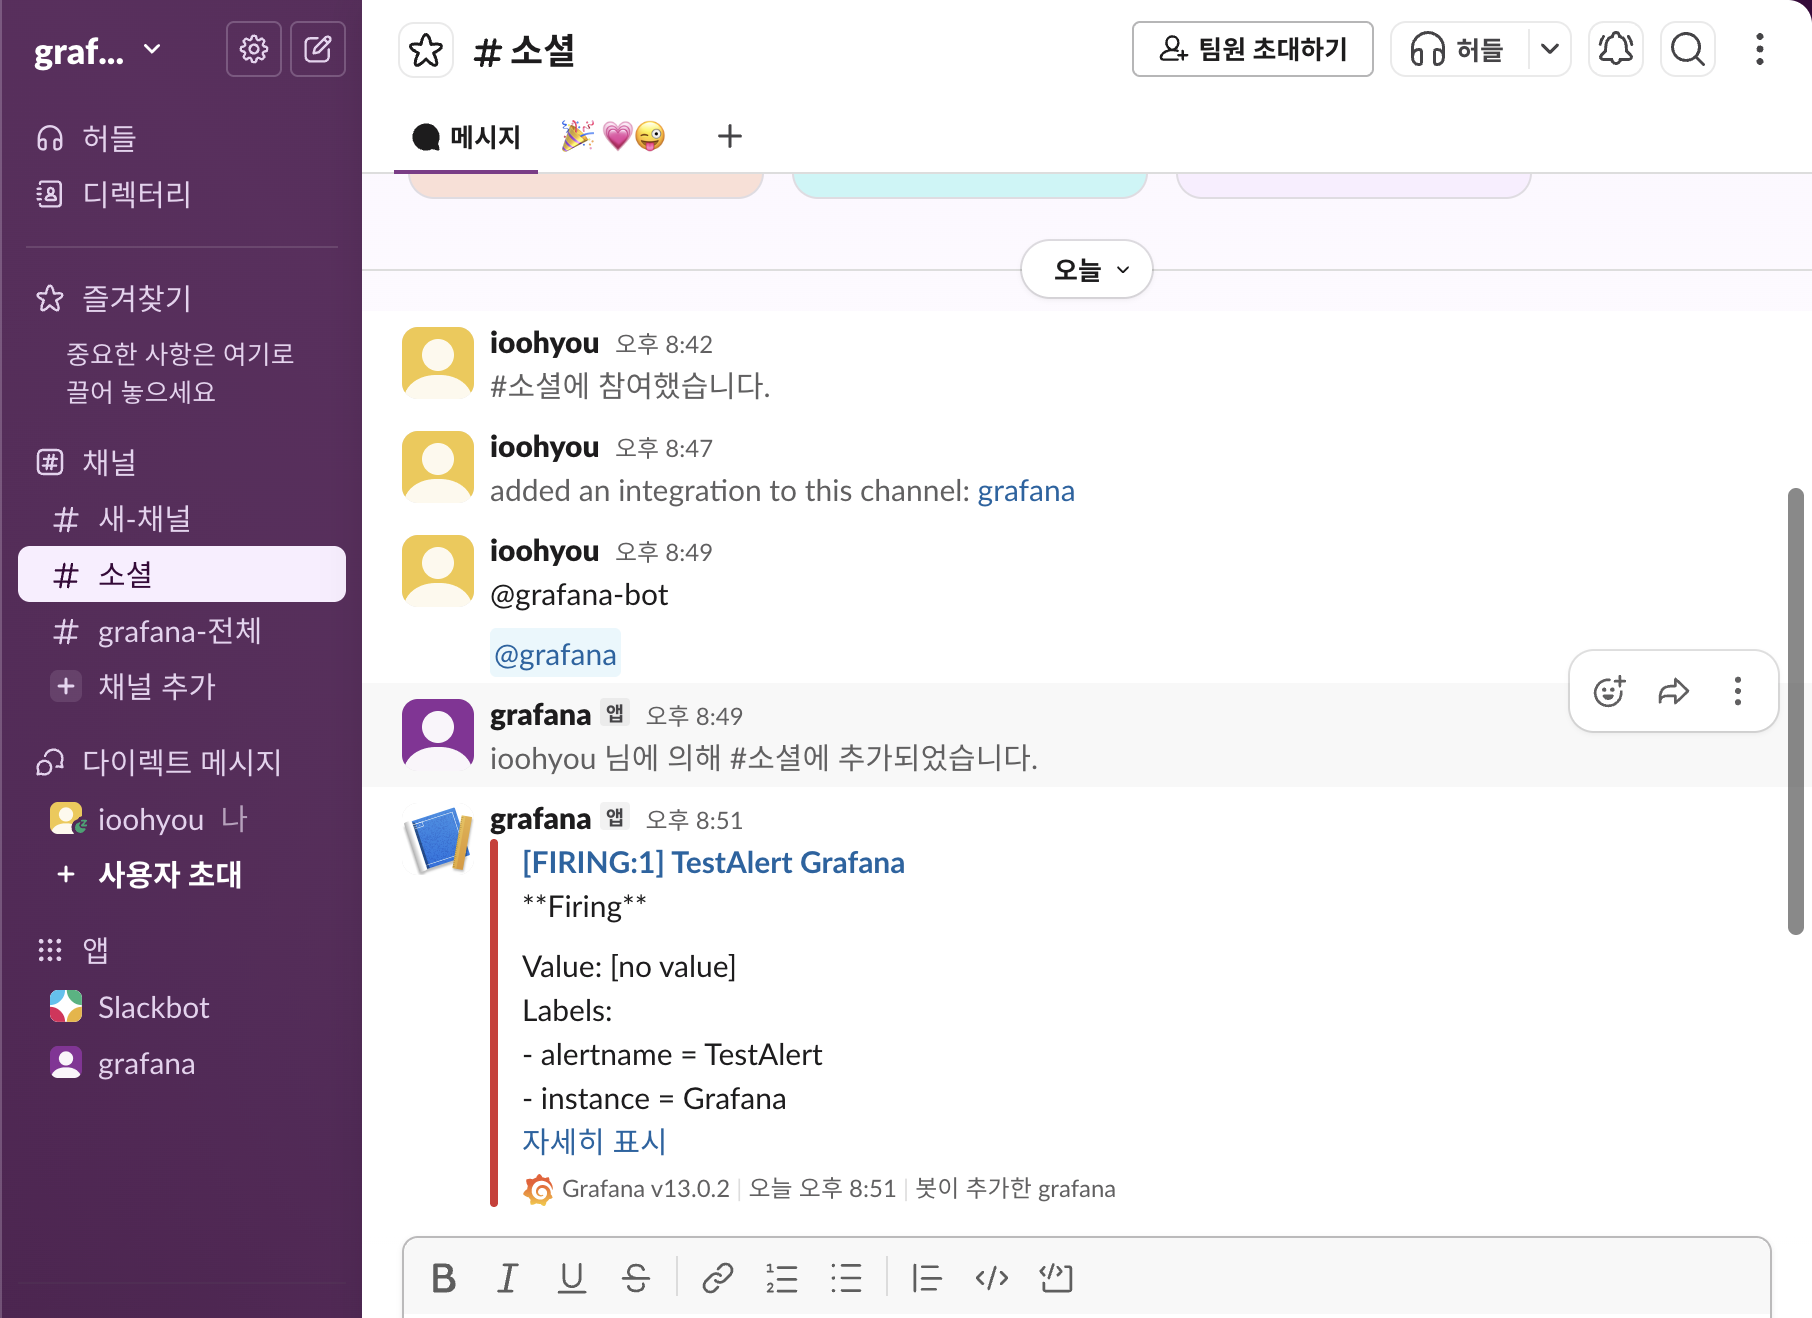
Confirm Slack message transmission with the Test button
Click Save contact point
Slack App creation screen
Webhook URL creation screen
Grafana Contact point setup screen
Slack test message reception screen
Alert Rule Settings
Create an Alert rule in Grafana.
The conditions were set as follows.
1
up{job="spring-boot"}
Threshold conditions are set as follows.
1
IS BELOW 1
This condition means that an alert is generated when the up{job="spring-boot"} value is less than 1.
In Prometheus, the up value is displayed as 1 if the target is collected normally, and 0 if it is not collected.Therefore, if the Spring Boot application is running normally, it becomes up = 1, and if the application is stopped, it becomes up = 0, resulting in an Alert condition.
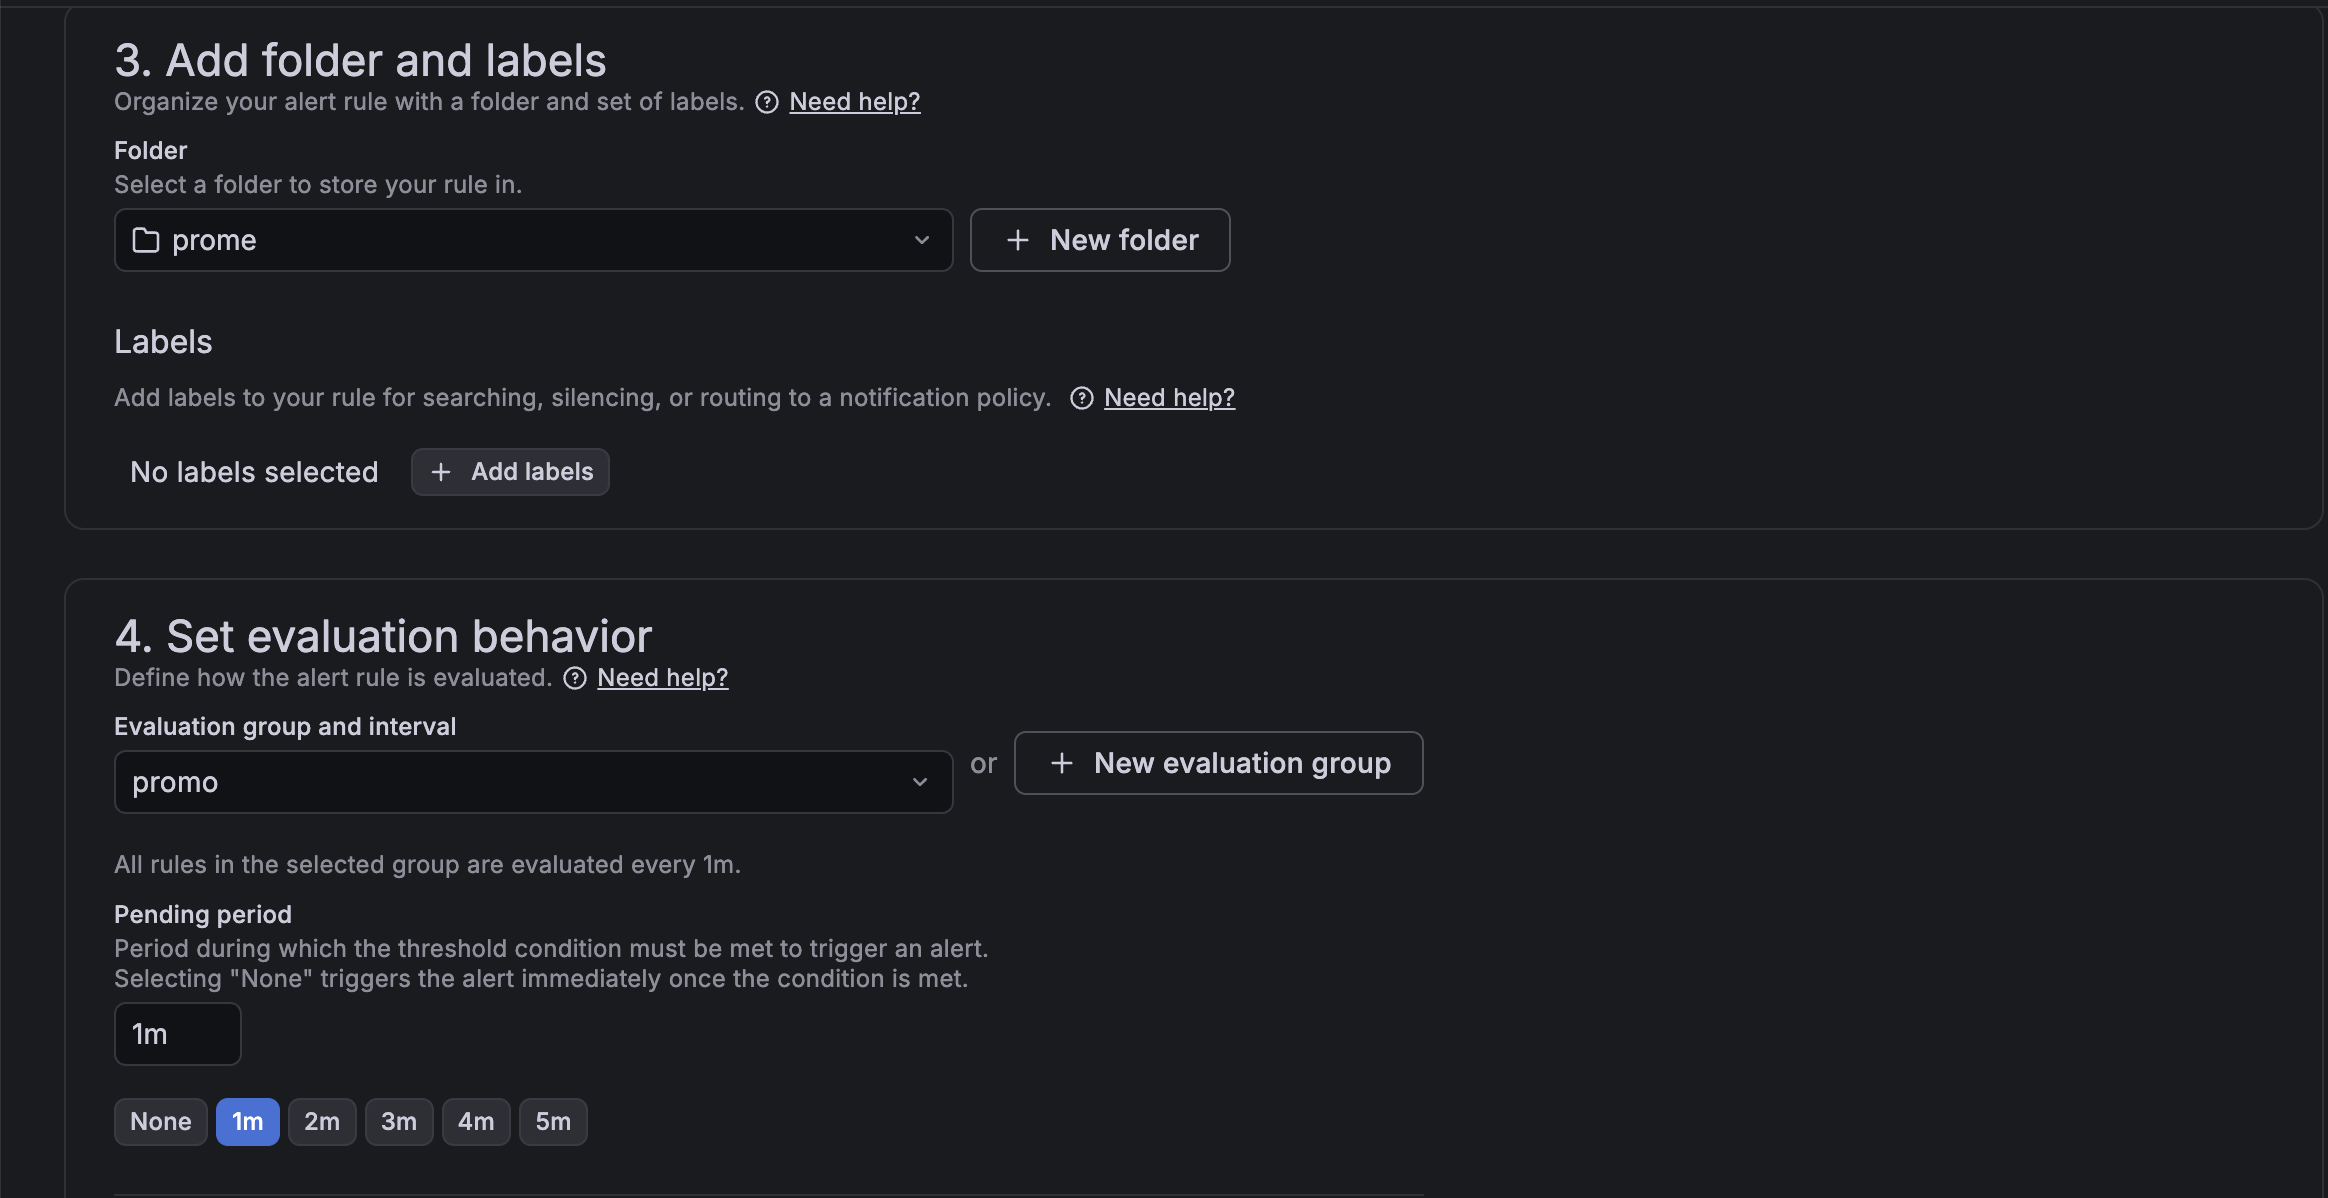
Evaluation settings
For quick confirmation, the Evaluation interval and Pending period were set to 1 minute.
1
2
Evaluation interval: 1m
Pending period: 1m
This setting means that Grafana evaluates the condition every minute, and changes to the Firing state if the condition holds for one minute.
In other words, a Slack notification does not come immediately as soon as the application is stopped, but a notification occurs only when the condition is maintained for a certain period of time.
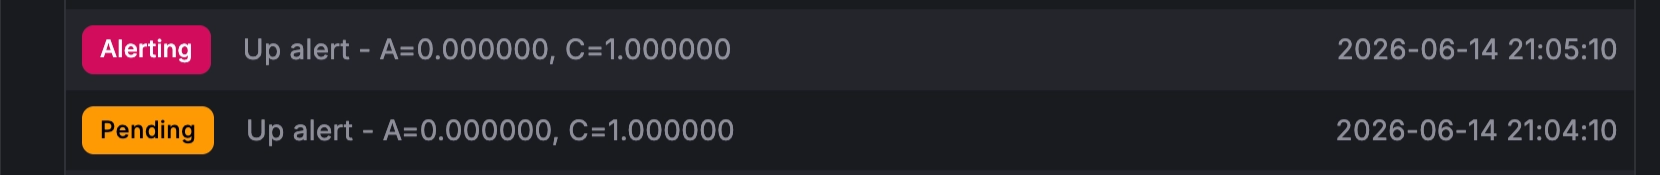
Alert state change
After saving the Alert rule and stopping the Spring Boot application, the status changes as follows.
1
Normal → Pending → Firing
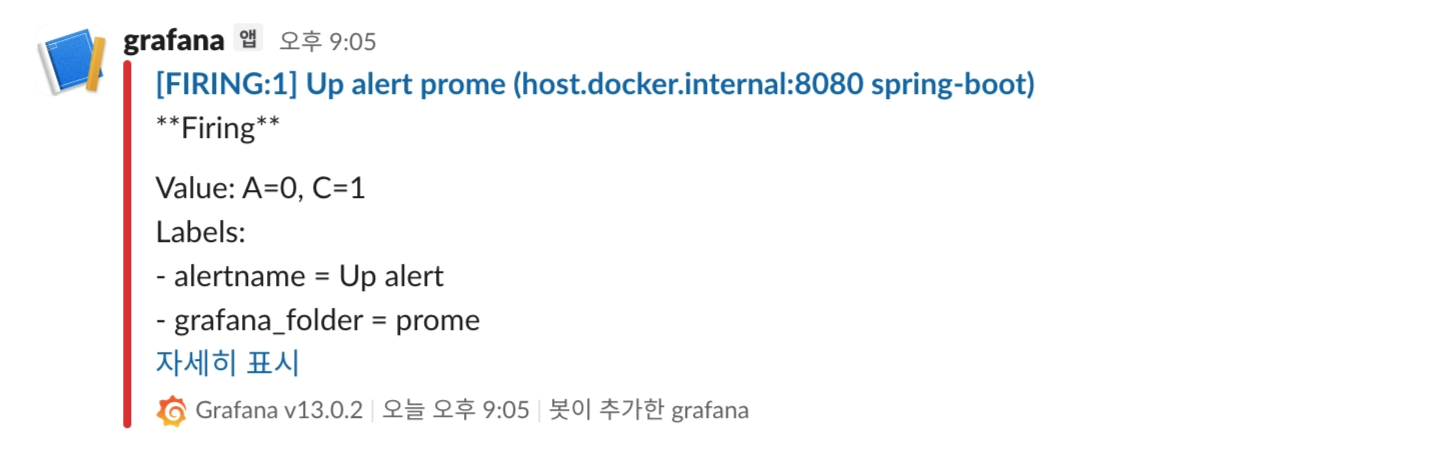
Afterwards, a firing notification is sent to Slack.
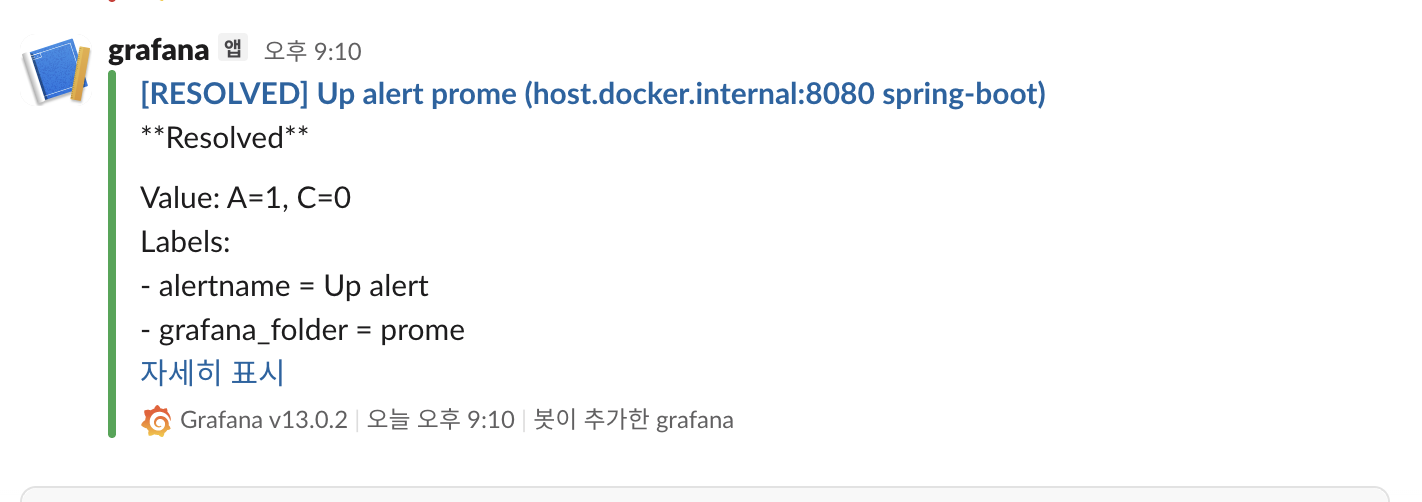
When you run the Spring Boot application again, the status returns to normal, and a Resolved notification is sent to Slack after a while.
1
Firing → Normal
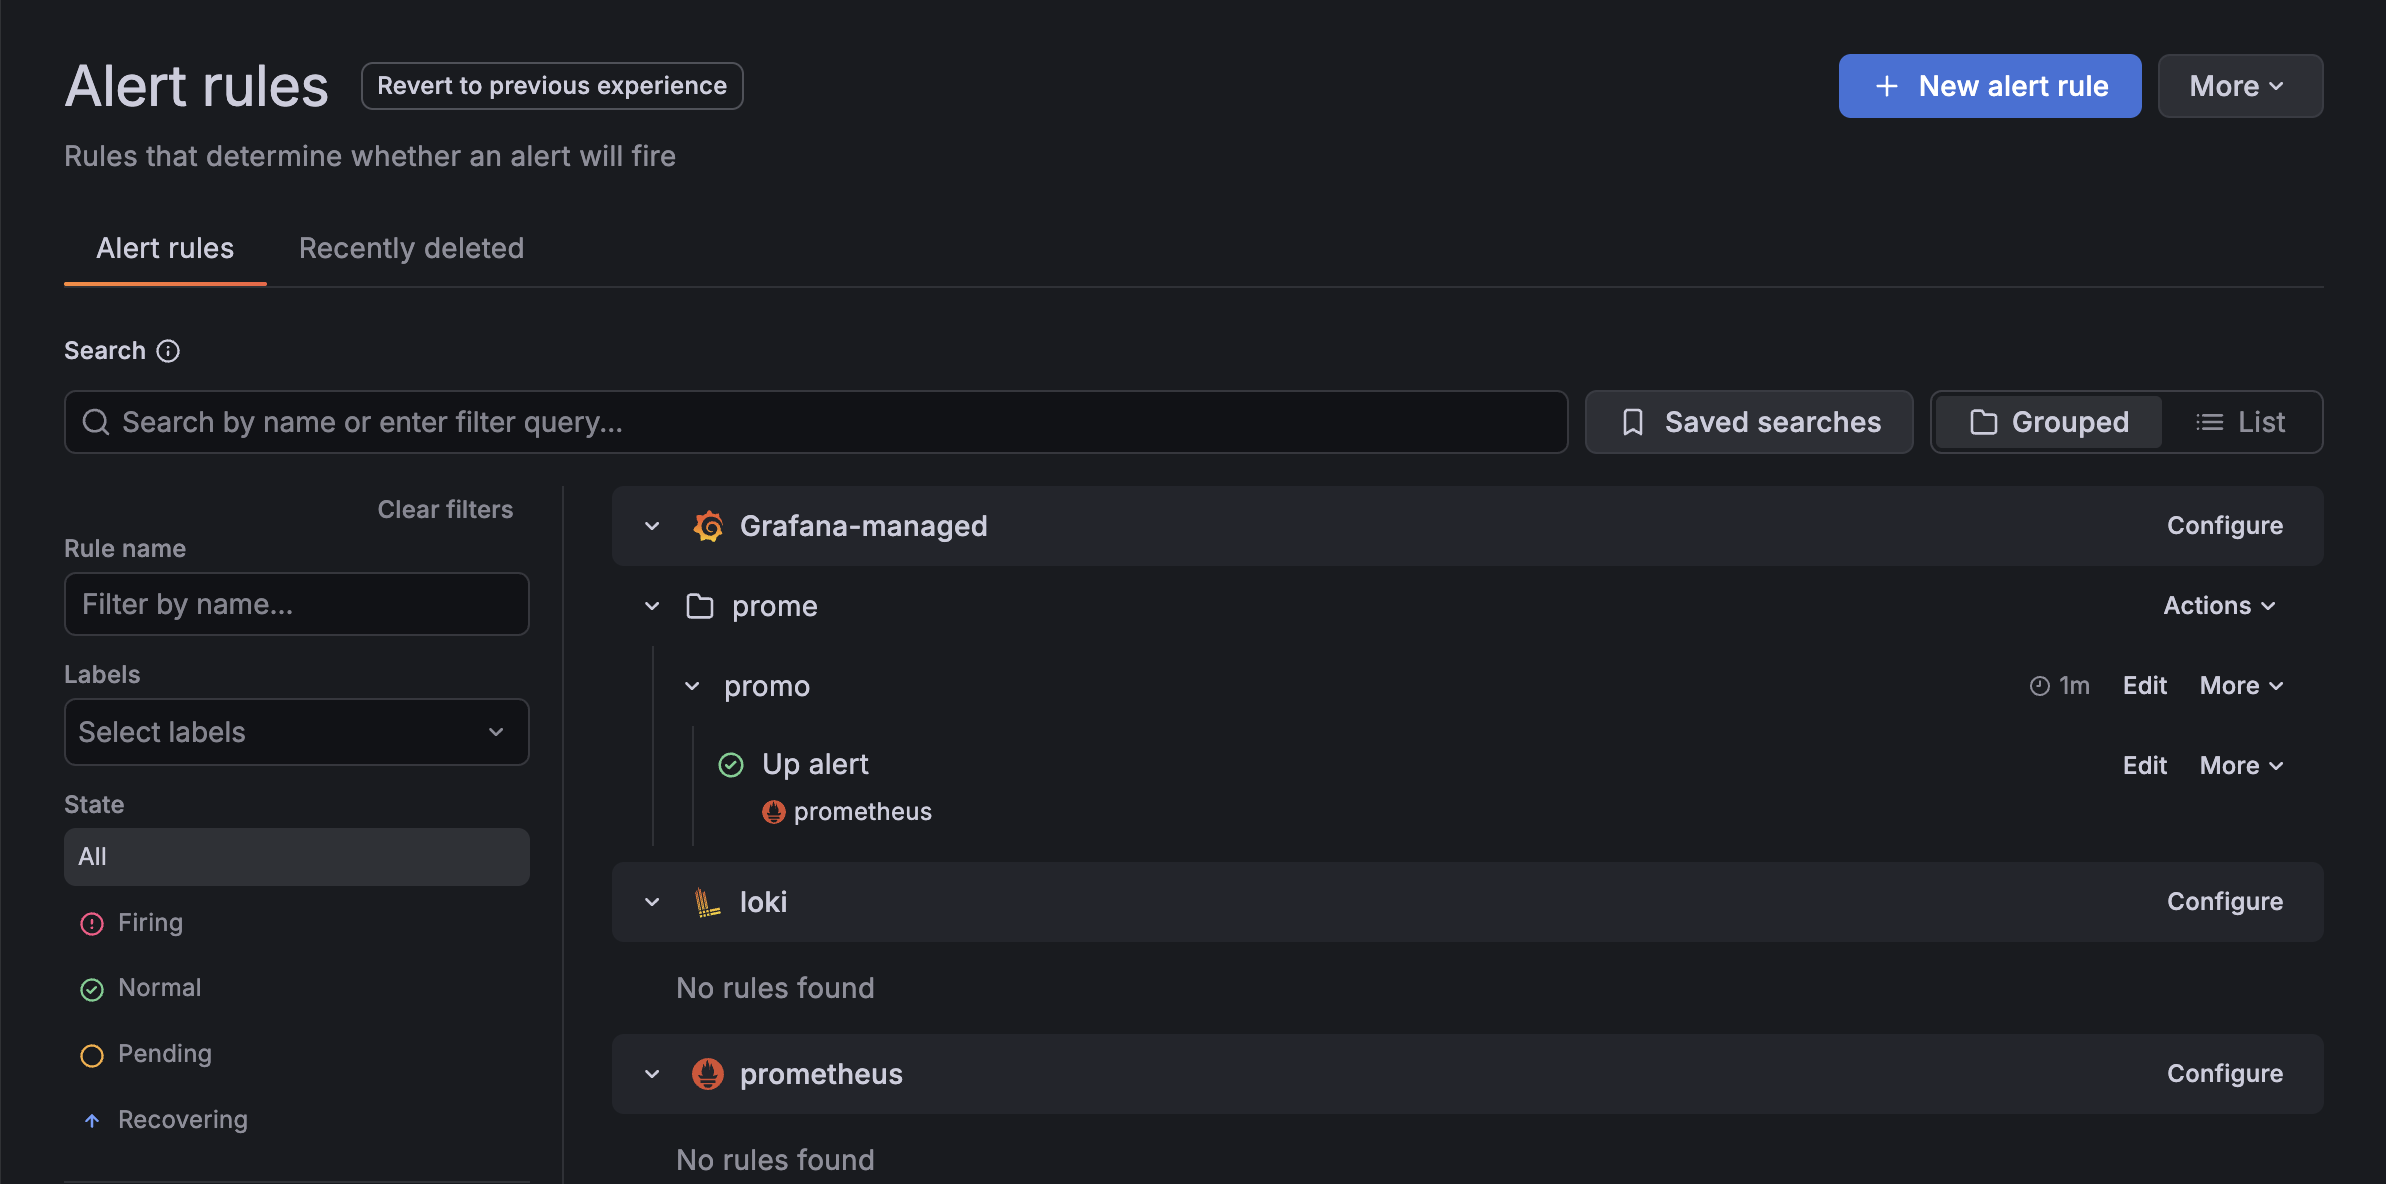
Alert rule creation,
up{job="spring-boot"}query setting screen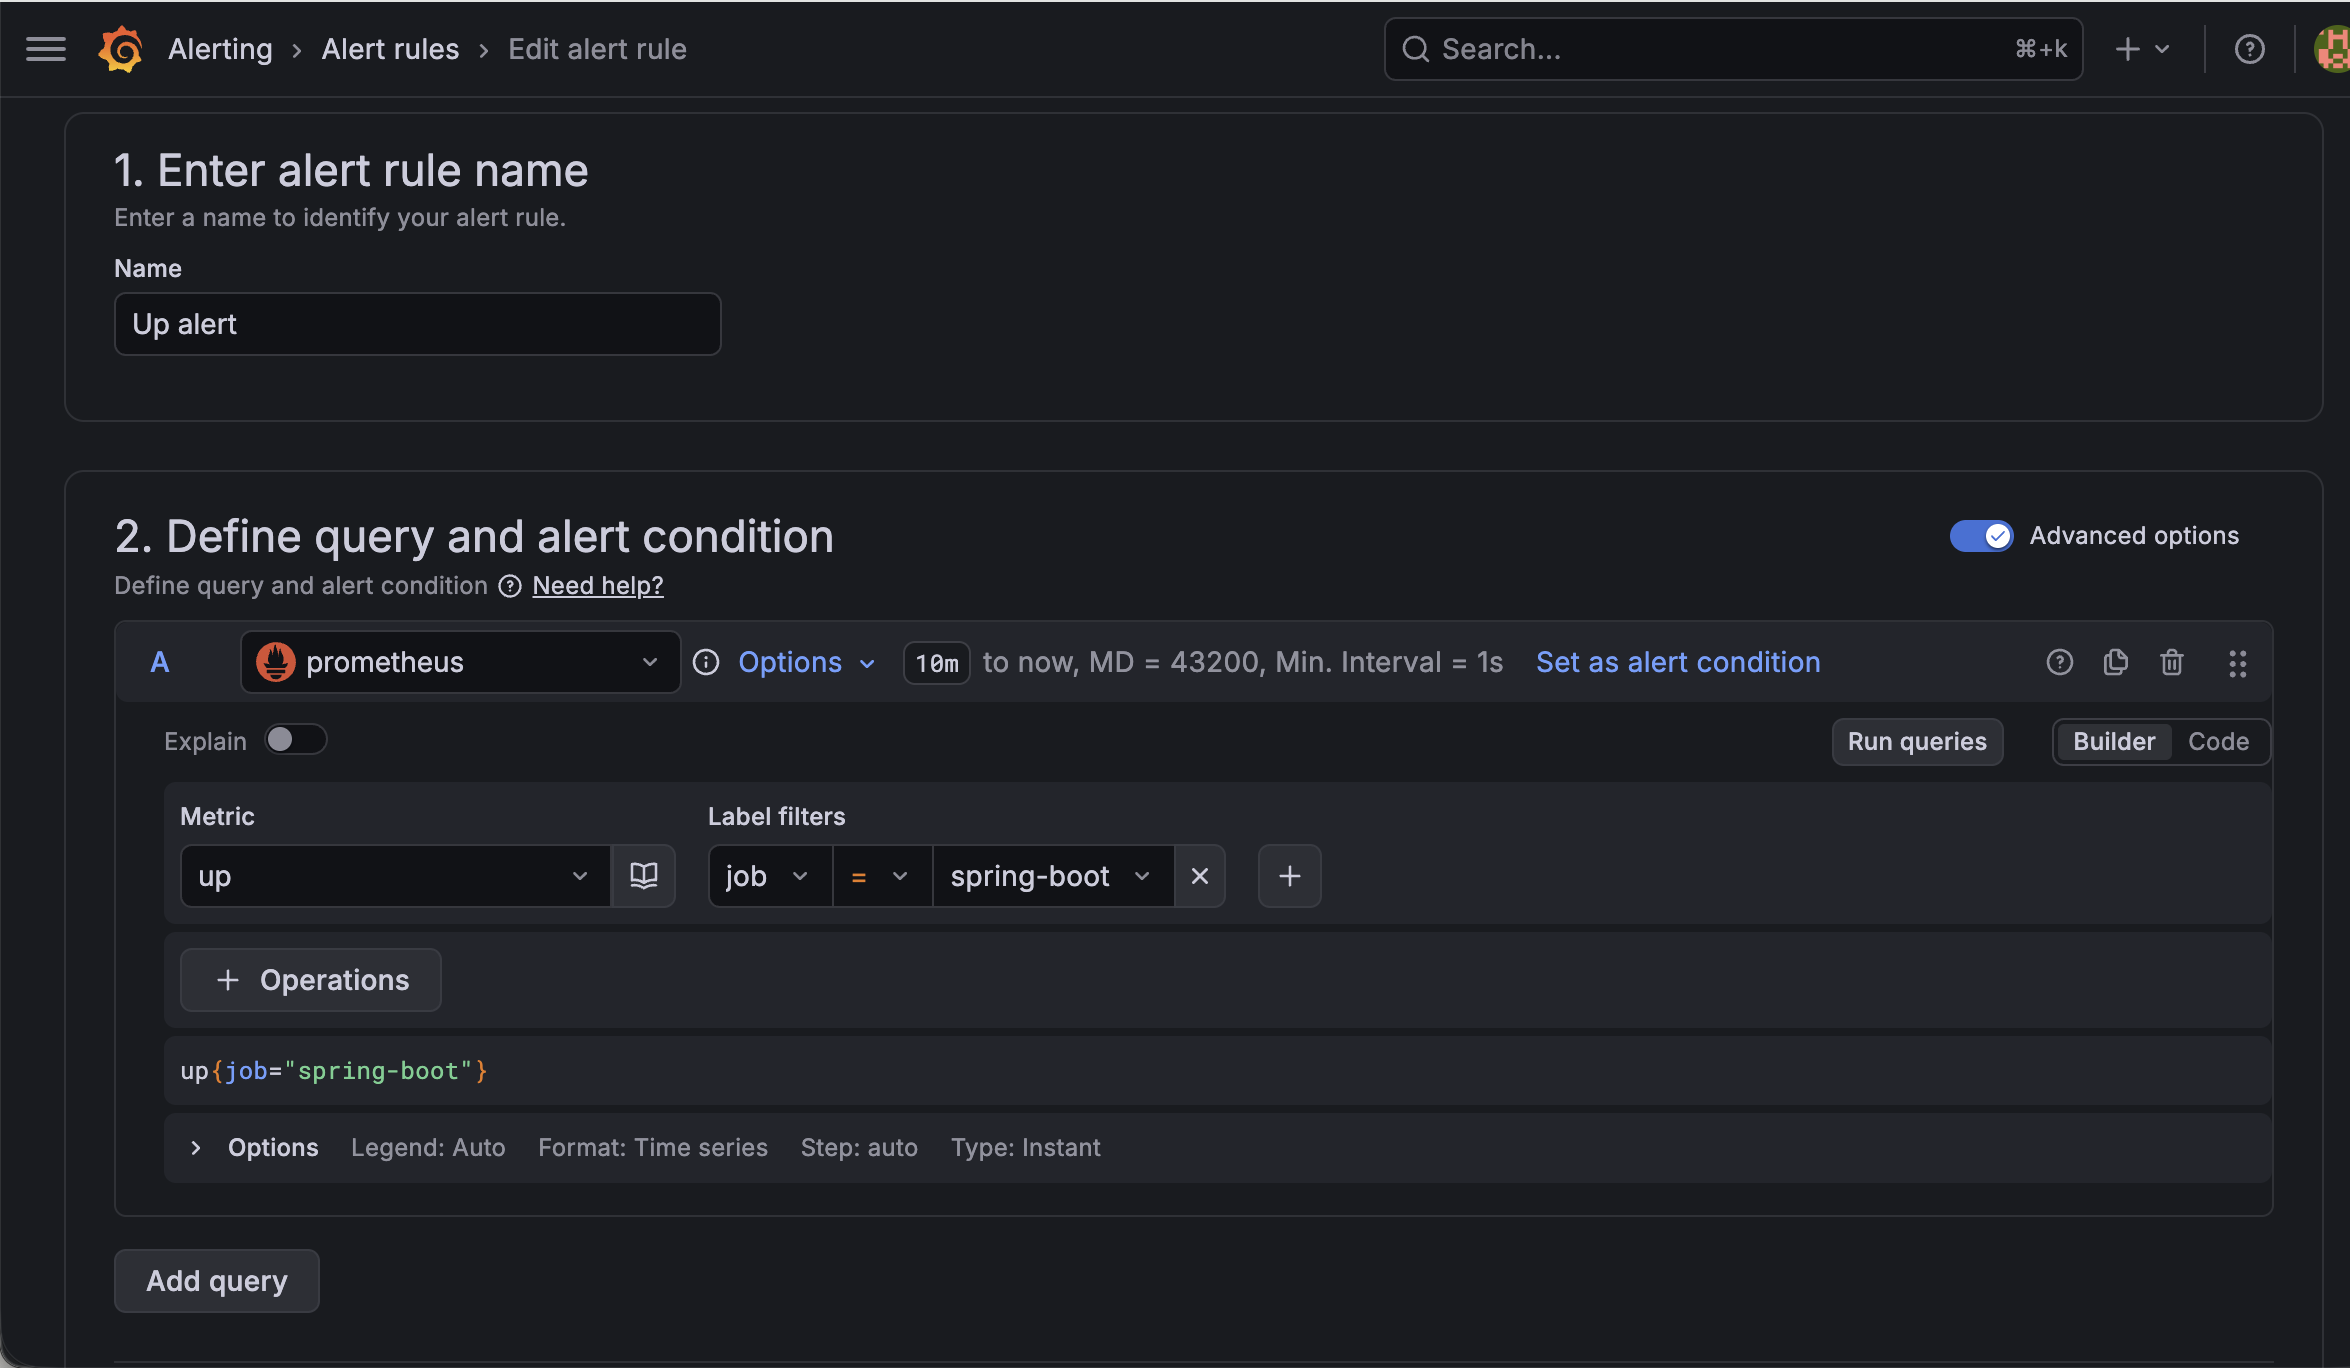
Threshold
IS BELOW 1setting screen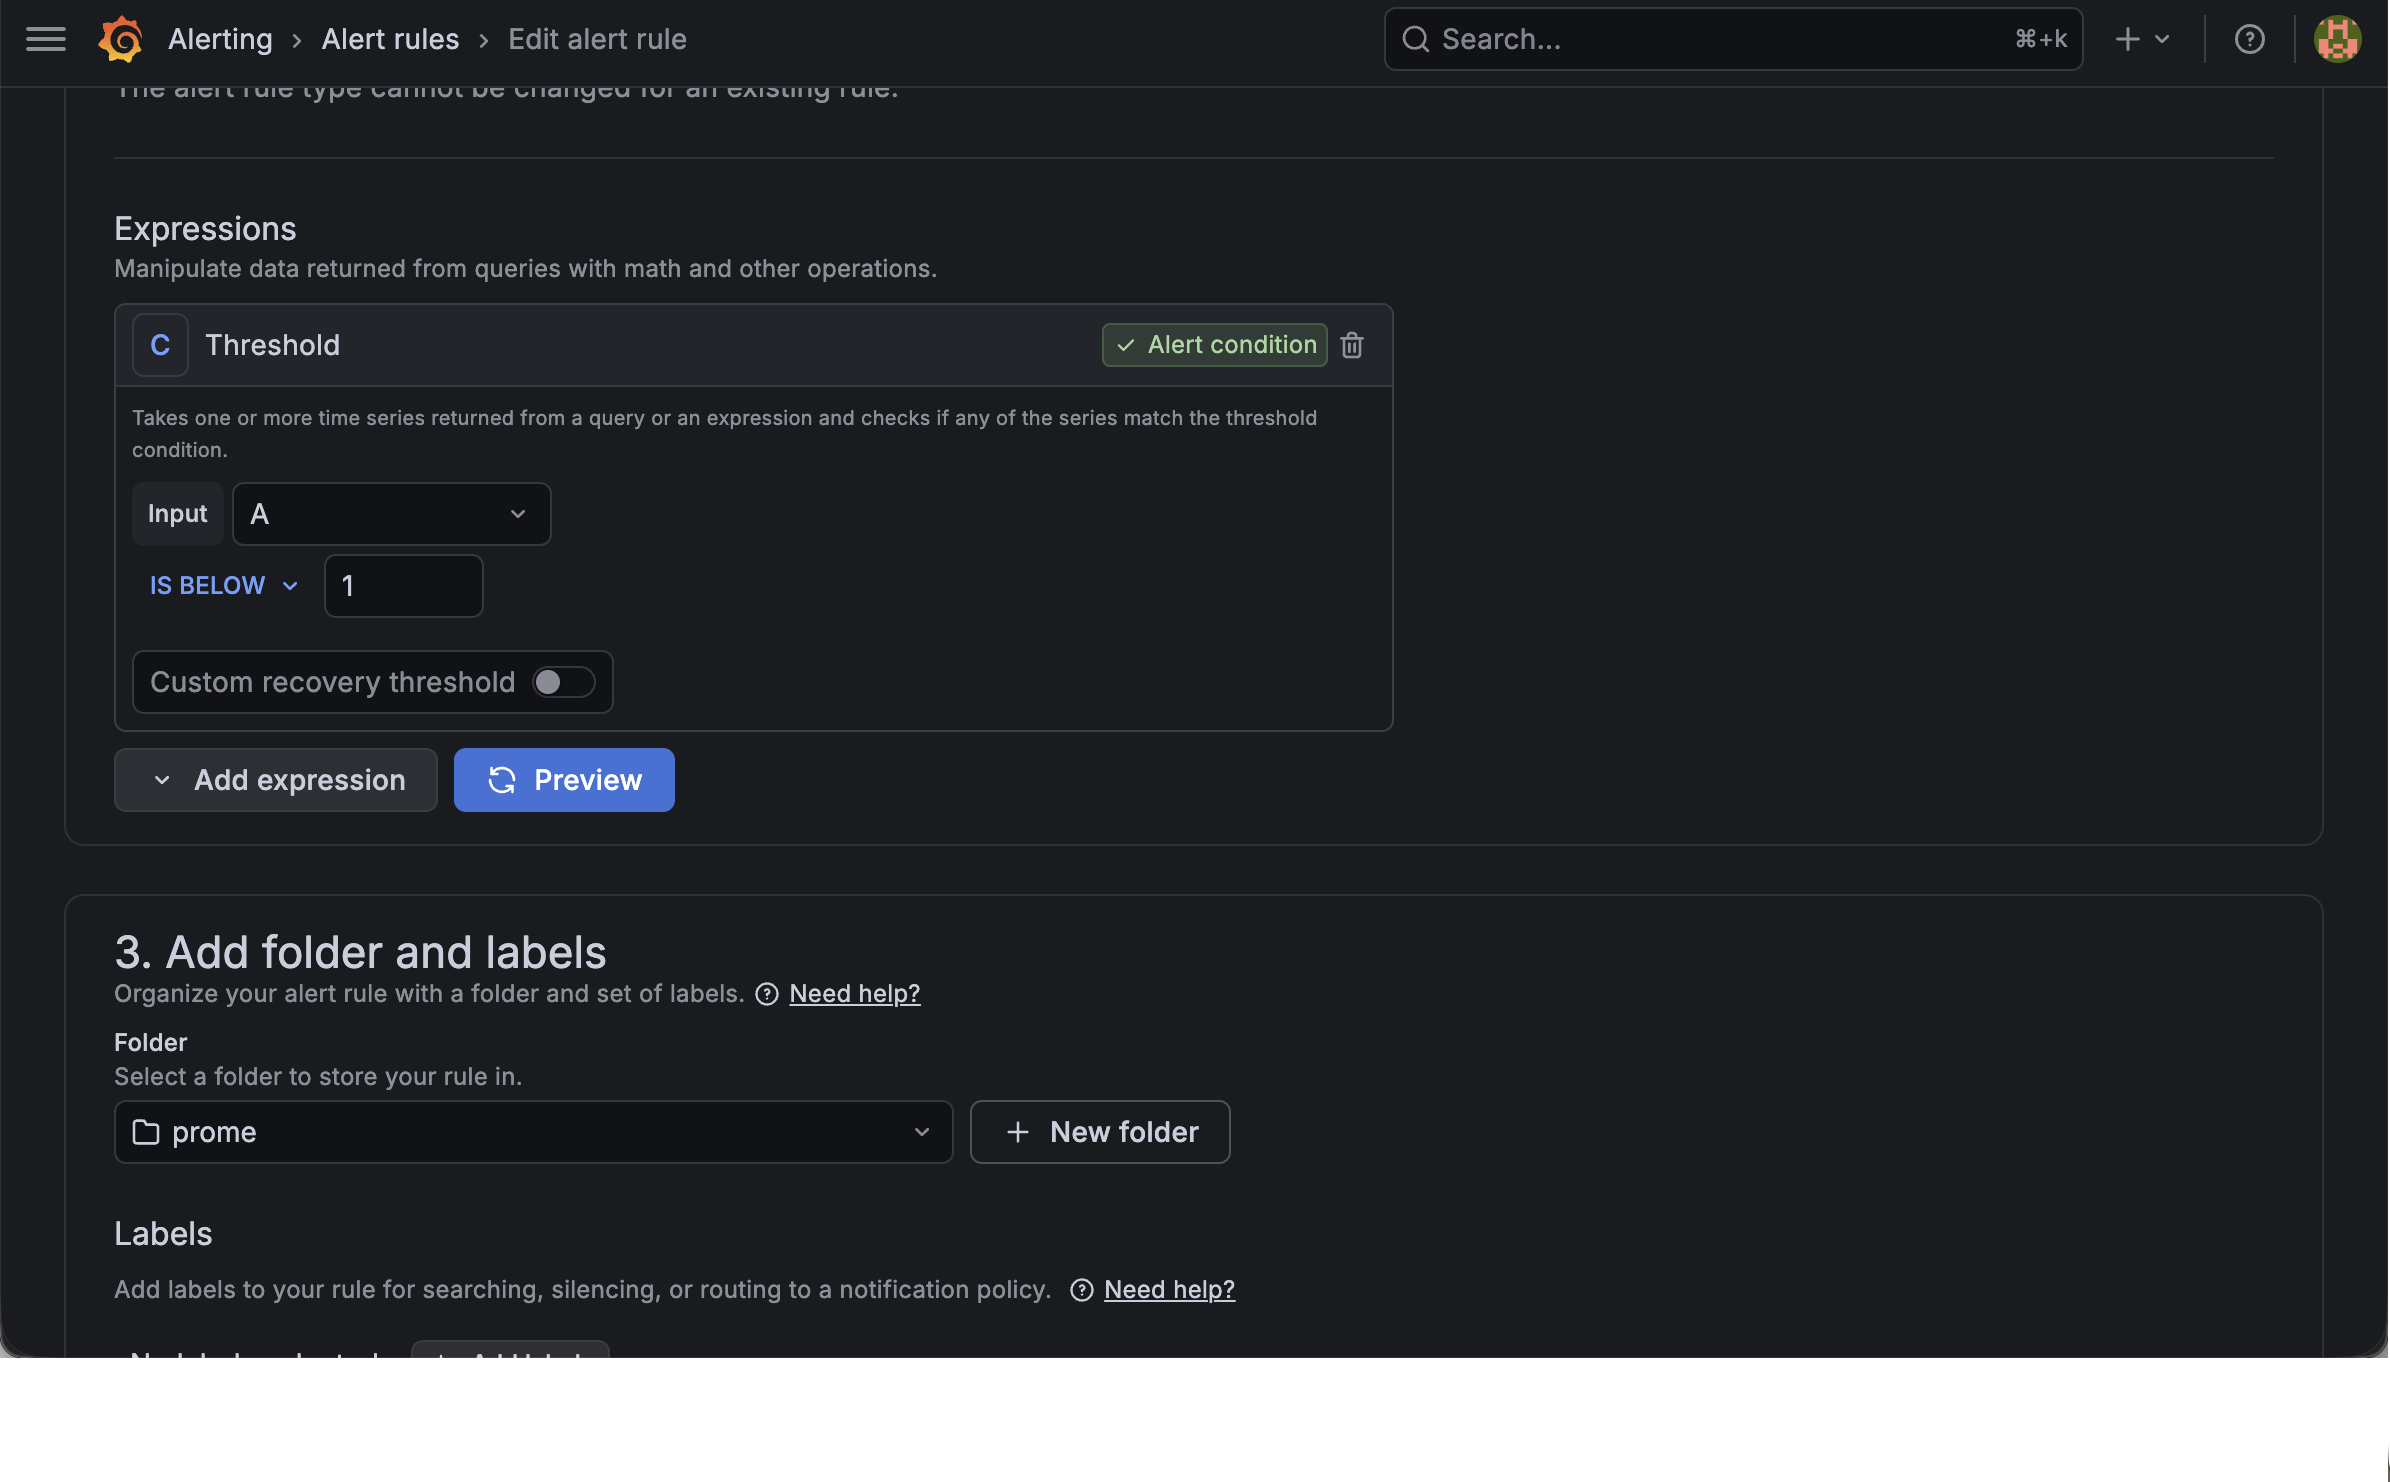
Evaluation interval, pending period setting screen
Screen with Alert status as Normal
Pending or Firing status screen after stopping Spring Boot
Slack Firing notification reception screen
Resolved notification reception screen after re-running Spring Boot
Application log monitoring using Loki
What is Loki?
Loki is a log collection and inquiry system developed by Grafana Labs.While Prometheus collects metrics, Loki collects application logs.
When used with Grafana, you can view not only metrics but also logs on one screen.
Why we need Loki
When a failure occurs, it is difficult to accurately determine the cause using metrics alone.
For example, you can check with Prometheus and Grafana that the server is down or errors have increased, but you can only find out why the error occurred by looking at the log.
Using Loki, application logs can be viewed directly in Grafana, making it easier to analyze the cause of failure.
In other words, while Prometheus and Grafana show us “what happened,” Loki helps us determine “why it happened.”
Spring Boot log transmission settings
Add the loki-logback-appender dependency to send logs from the Spring Boot application to Loki.
1
2
3
4
5
6
dependencies {
    implementation 'com.github.loki4j:loki-logback-appender:1.5.1'
    implementation 'org.springframework.boot:spring-boot-starter-actuator'
    implementation 'org.springframework.boot:spring-boot-starter-web'
    runtimeOnly 'io.micrometer:micrometer-registry-prometheus'
}
For testing, write a controller so that a 403 error and a log are generated when the root path is accessed.
1
2
3
4
5
6
7
8
9
10
11
12
13
14
15
16
17
18
19
20
import jakarta.servlet.http.HttpServletResponse;
import org.slf4j.Logger;
import org.slf4j.LoggerFactory;
import org.springframework.web.bind.annotation.GetMapping;
import org.springframework.web.bind.annotation.RestController;

import java.io.IOException;

@RestController
public class SampleController {

    private static final Logger logger = LoggerFactory.getLogger(SampleController.class);

    @GetMapping("/")
    public String hello(HttpServletResponse response) throws IOException {
        logger.info("Attempted access to / endpoint resulted in 403 Forbidden");
        response.sendError(HttpServletResponse.SC_FORBIDDEN, "Access Denied");
        return null;
    }
}
Create a resources/logback.xml file and set the log to be sent to Loki.
1
2
3
4
5
6
7
8
9
10
11
12
13
14
15
16
17
<configuration>
    <appender name="LOKI" class="com.github.loki4j.logback.Loki4jAppender">
        <http>
            <url>http://localhost:3100/loki/api/v1/push</url>
        </http>
        <format>
            <label>
                <pattern>app=my-app,host=${HOSTNAME}</pattern>
            </label>
            <message class="com.github.loki4j.logback.JsonLayout" />
        </format>
    </appender>

    <root level="DEBUG">
        <appender-ref ref="LOKI" />
    </root>
</configuration>
Run Loki
After creating the Loki configuration file loki-config.yml, run Loki with Docker.
1
2
3
4
5
6
docker run --name loki -d \
  - v /path/to/loki-config.yml:/mnt/config/loki-config.yml \
  - p 3100:3100 \
  grafana/loki:3.0.0 \
  - config.file=/mnt/config/loki-config.yml
After executing, connect to the following address and check whether Loki is running normally.
1
http://localhost:3100/ready
If running normally, ready is output.
localhost:3100/readyconnection result screen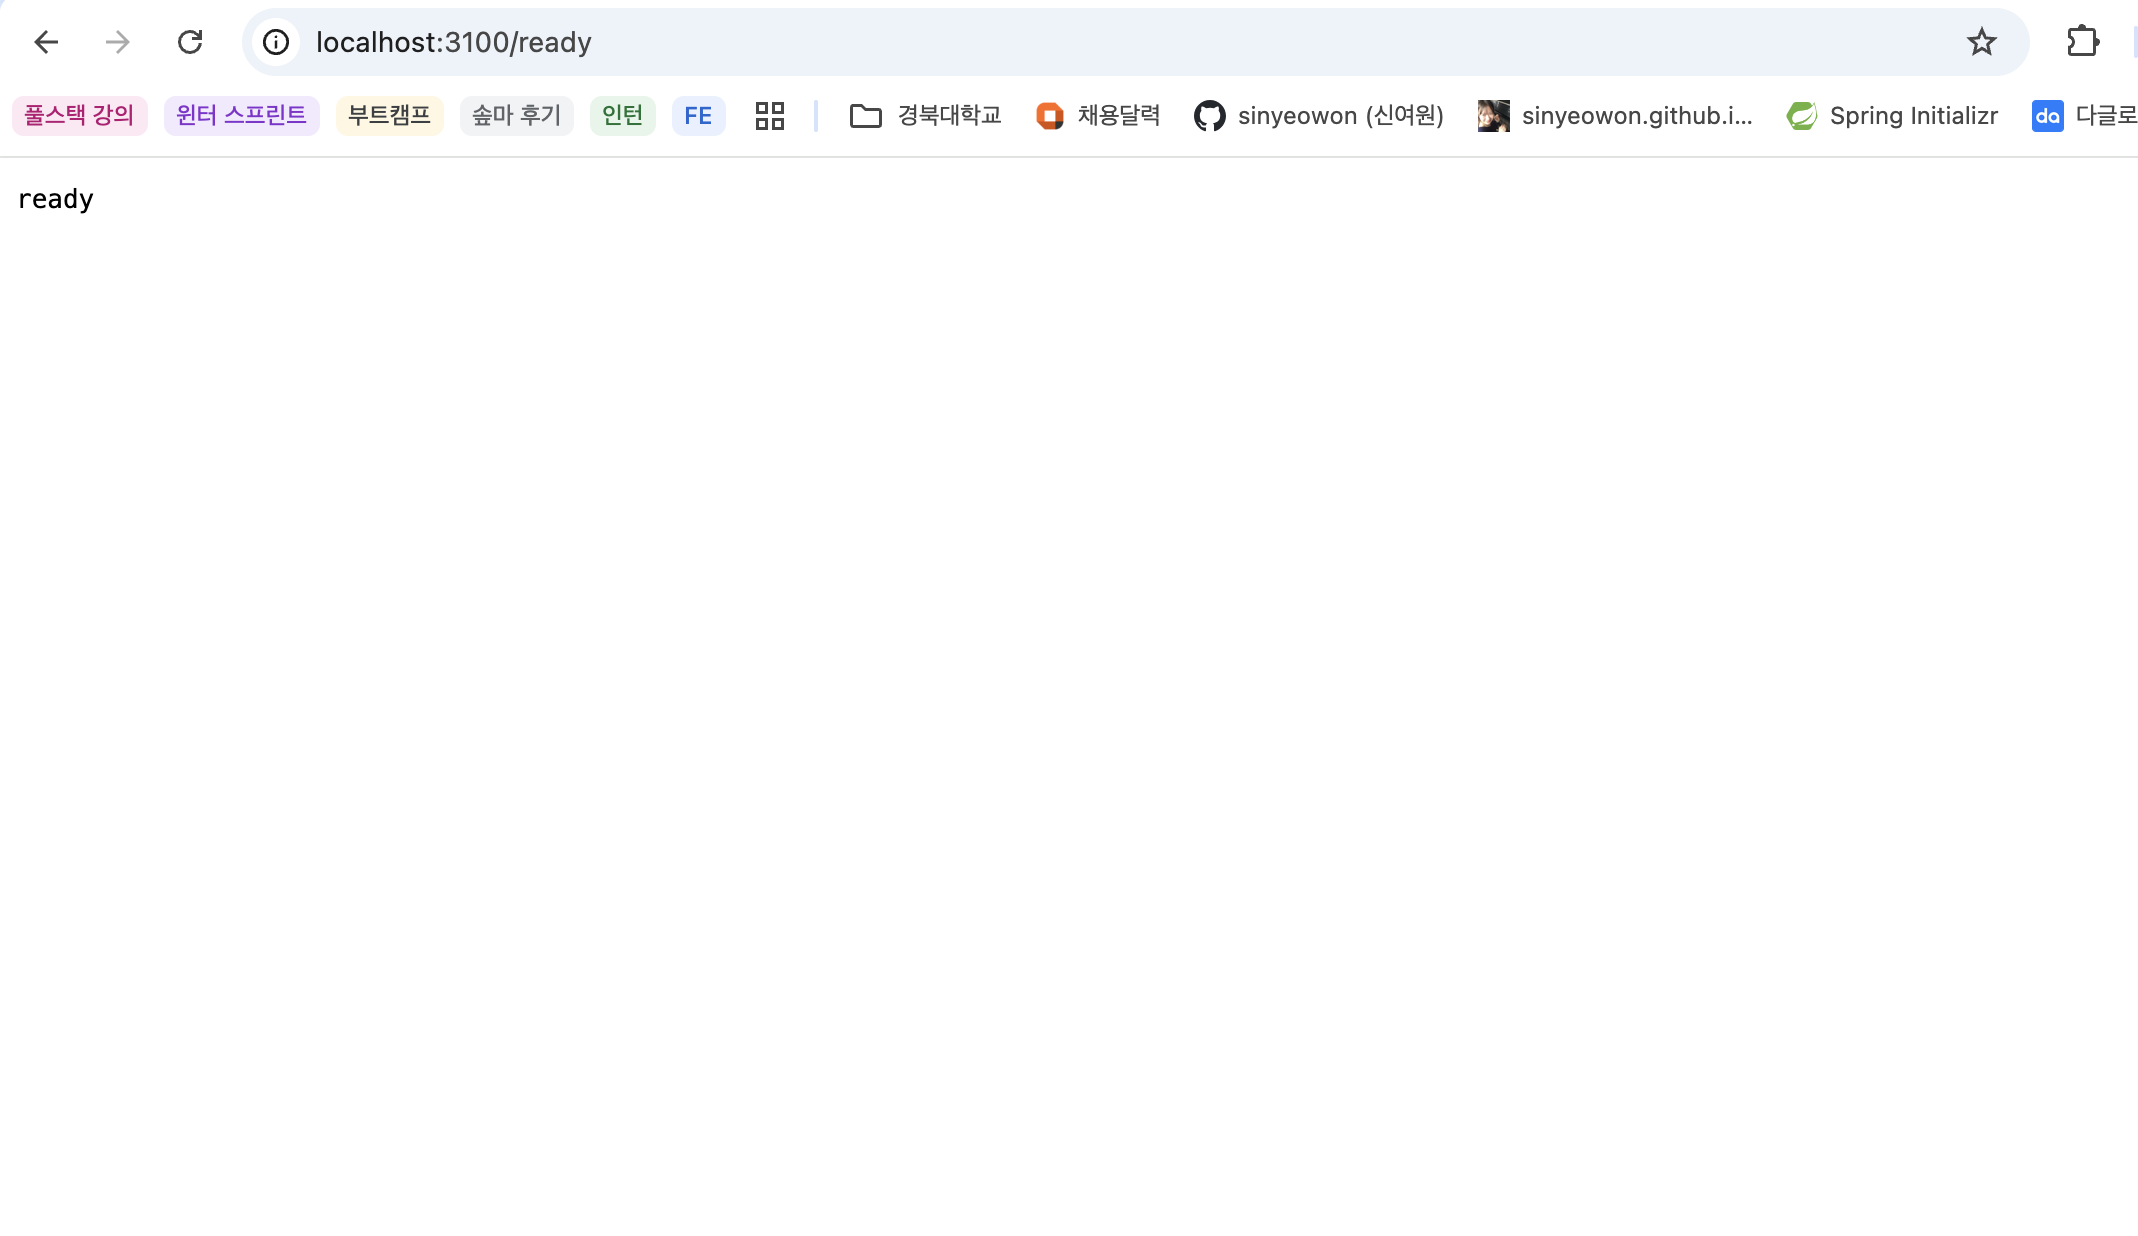
Add Loki Data source in Grafana
To search Loki logs in Grafana, you must add Loki as a data source.
The setting sequence is as follows.
Move to Grafana Data sources menu
Click Add new data source
Choose Loki
Enter Loki URL
Click Save & testEnter the following address so that Grafana can access Loki in the Docker environment.
1
http://host.docker.internal:3100
Check logs in Grafana Explore
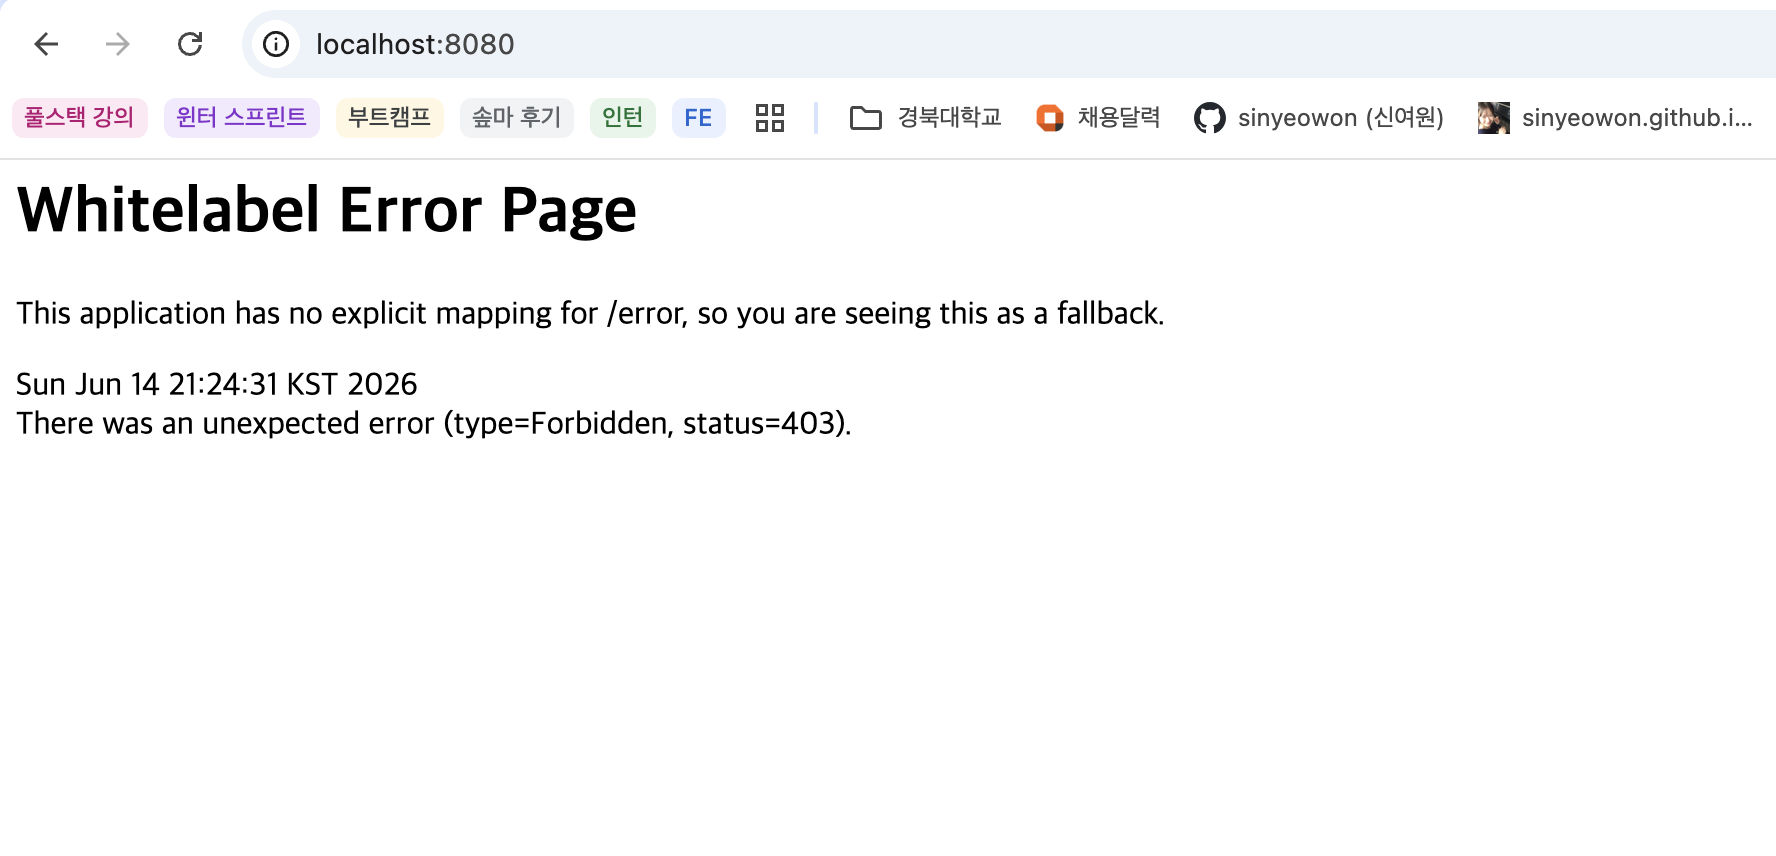
Accessing the root page of the Spring Boot application causes a 403 error.
1
http://localhost:8080
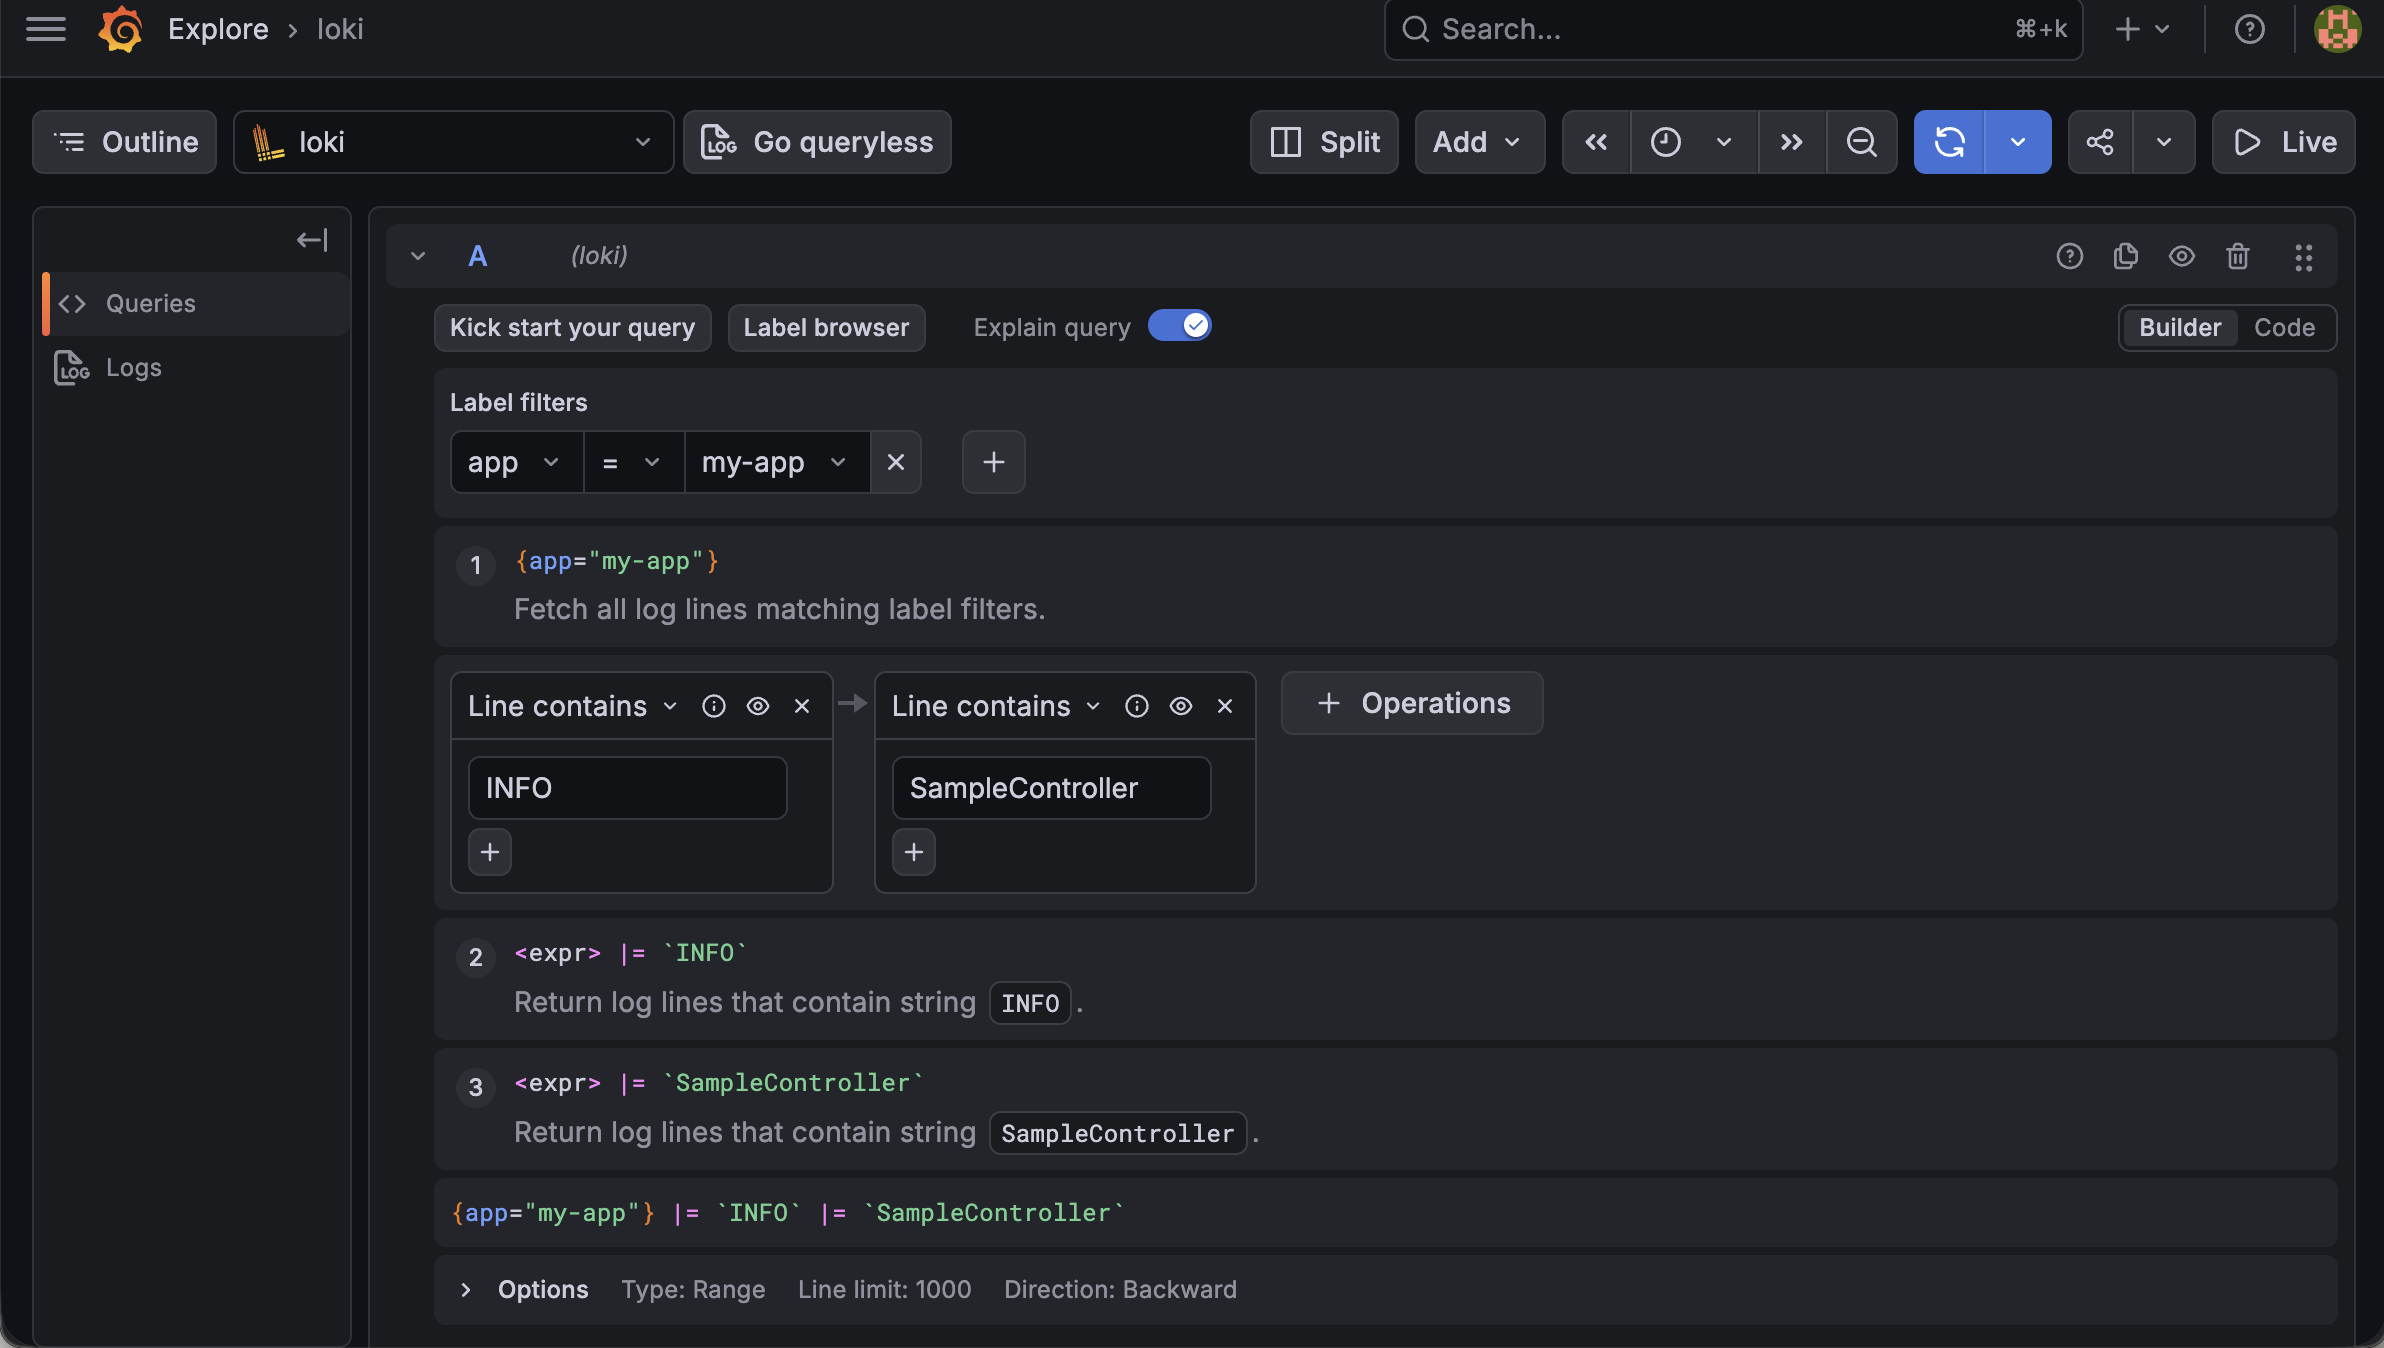
Afterwards, go to the Explore menu in Grafana, select Loki, and run a log query.
An example query is as follows:
1
{app="my-app"}
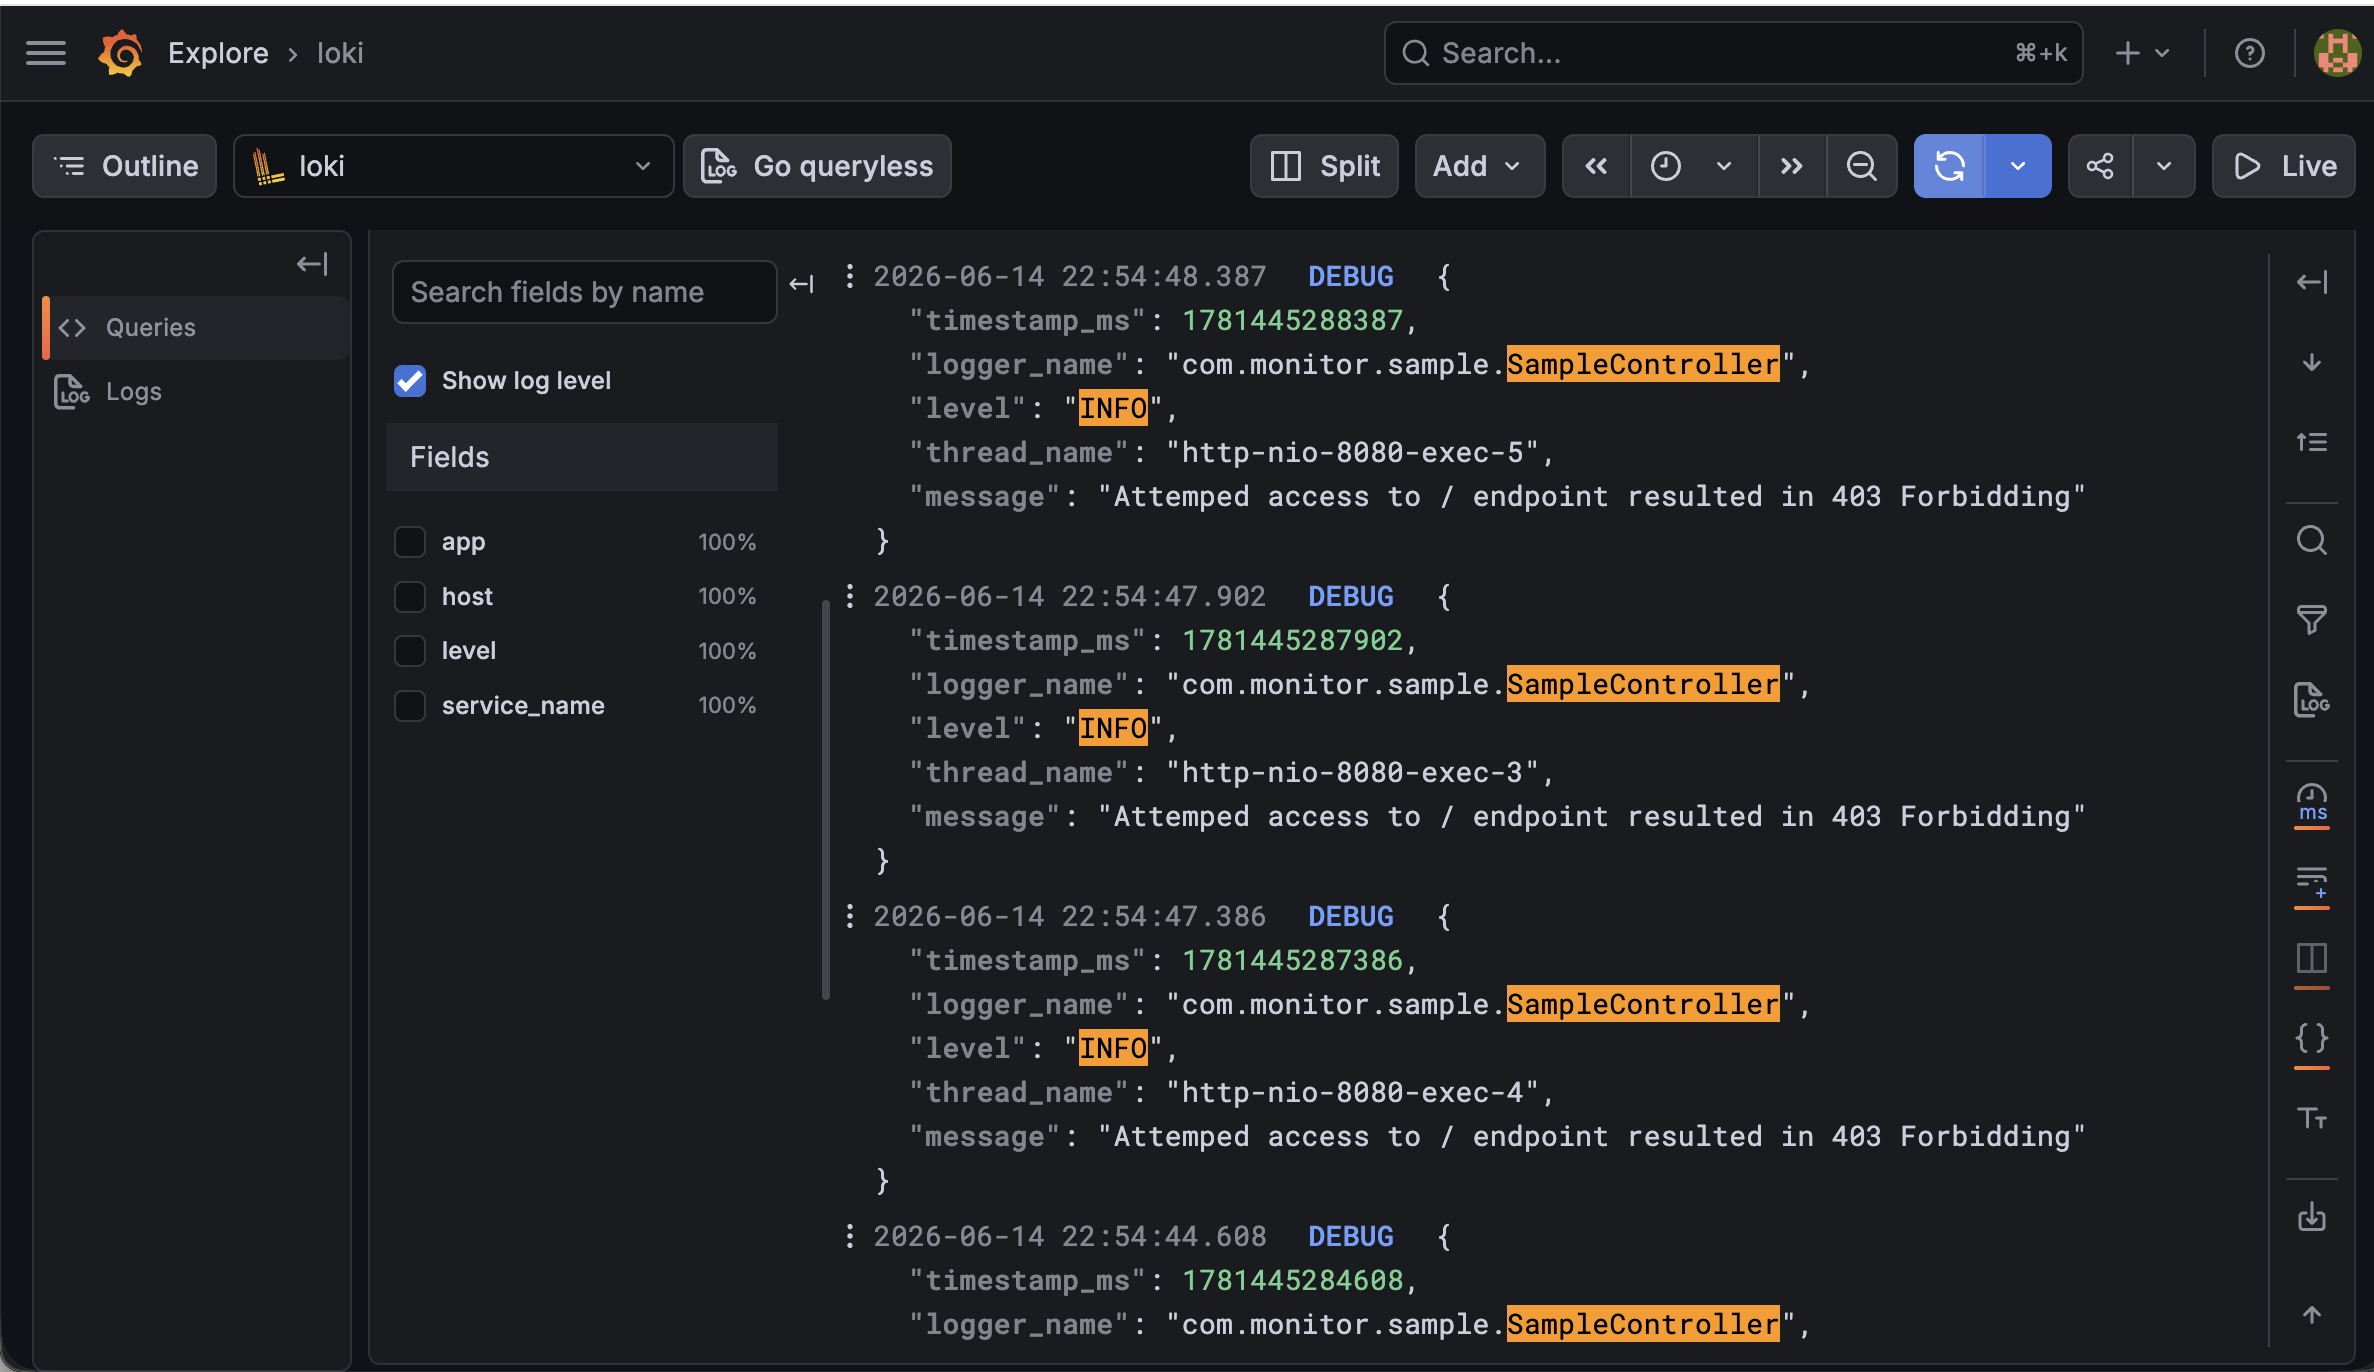
When you run a query, you can check logs generated from the Spring Boot application in Grafana.
403 error screen when accessing the root page
Loki log search screen in Grafana Explore
Clean up the entire flow
The overall flow of this exercise is as follows.
1
2
3
4
5
6
7
8
9
10
11
12
13
14
Spring Boot Actuator
→ 애플리케이션 상태와 메트릭 노출

Prometheus
→ Actuator의 Prometheus 메트릭을 주기적으로 수집

Grafana
→ Prometheus 데이터를 시각화

Grafana Alert + Slack
→ 애플리케이션 장애 발생 시 Slack 알림 전송

Loki
→ 애플리케이션 로그 수집 및 Grafana에서 조회
In summary, Actuator provides the status of the application to the outside, Prometheus collects the data, Grafana visualizes it, Slack Alert notifies failures, and Loki provides logs for analysis of the cause of failures.
Things I was confused about during practice
Issue where Slack notifications did not arrive immediately
After setting the alert rule, I stopped the Spring Boot application, but the Slack notification did not come right away.
At this time, we learned that the Evaluation interval and Pending period are each set to 1 minute, so even if the condition is met, it does not immediately enter the Firing state, but that the notification occurs only when the condition is maintained for a certain period of time.
Additionally, you must save the Alert rule after creating it, and check whether the Slack Webhook operates normally through a contact point test.
up{job="spring-boot"}** **What the values mean
At first, I was confused about what exactly the up metric meant.If the up{job="spring-boot"} value is 1, it means that Prometheus is normally collecting the metrics of the Spring Boot application, and if it is 0, it means that the collection failed.
Therefore, when the application is stopped, the failure situation can be detected by using the up < 1 condition.
Lessons learned and reflections
Through this exercise, I learned that monitoring is not simply “checking whether the server is turned on,” but is a process of configuring status information, metrics, logs, and notifications necessary for application operation.
In particular, the roles of Actuator, Prometheus, and Grafana felt similar at first, but as the practice progressed, I was able to understand that each had different responsibilities.
Actuator exposes the state and metrics of the Spring Boot application to the outside, and Prometheus periodically collects and stores the metrics. Grafana visualizes Prometheus data to make it easier for people to view, and the Alert function can notify failure situations through Slack. Loki collects application logs to help analyze the cause when a failure occurs.
The most impressive part of this lab was Slack Alert.
I felt connected to the actual operating environment by being able to receive notifications through Slack when the application stopped even if I wasn’t looking at the dashboard directly. I learned that it’s not enough to simply write code, but also to consider how to recognize and respond when a service dies.
Additionally, depending on the Grafana version, the UI was different, so there were situations that were different from what was expected, such as not seeing the same button as in the lecture, or not receiving a notification right away after setting up the alert. During this process, I felt that I had to solve problems by understanding the current settings and how the tools work, rather than simply following the lecture screens.
In conclusion, through this study, I was able to experience looking at Spring Boot applications from an operational perspective. When working on future projects, I felt that I needed to become a back-end developer who not only implemented functions but also considered status checks, error detection, and log analysis.